(This article is re-formatted from the following publication:
Mustacich, Robert V. 2016. Digital Image Differencing of High Resolution Stamp Images.
Proceedings of the Second International Symposium on Analytical Methods in Philately,
Itasca, IL, November 2015, John H. Barwis and Thomas Lera, eds.,
Wilcox Printing and Publishing, Inc., Madrid, IA, pp. 57-72.)
Robert V. Mustacich, 722 Camino Cascada, Santa Barbara, CA 93111
ABSTRACT . A new method for comparing high resolution stamp images allows the direct subtraction of the raw data of one image from another to reveal small differences over the entirety of the stamps. The method corrects for small differences in size, orientation, color, and also spatial distortions resulting from uneven paper shrinkage. Minor printing plate differences, arising from die re-entries or other plate flaws, can be easily visualized over the entirety of the stamp. In addition, the image corrections provide a means to directly compare the intrinsic differences between plate impressions. The intra-sheet differencing of stamp images gives reproducible comparisons which appear to be relatively independent of paper shrinkage. This indicates that these are direct measurements of the differences in the plate impressions created by the transfer roll in the production of the plates.
Introduction
Analysis of digital images gives us a deeper understanding of the stamps that we collect. Direct manipulation of raw image data has been used to visualize features such as a cancel, watermark, or gum disturbance. A variety of software is available which makes changes to color balance, contrast, or overlay transparencies. [1] Comparing ink colors may be done by complex spectrophotometric equipment, or by a simple desktop scanner (Lyerla, 2014). We can gain additional visual information about small changes in images using a blink comparator, a method used in astronomy that was developed more than a century ago (Zeiss, 1904). In this approach, small differences between two images can be quickly noticed by rapidly switching between two aligned images. [2]
A more in-depth comparison of two stamp images might be produced by directly subtracting the raw data of one image from another but, until this time, this procedure was not available. Significant difficulties provided obstacles. First, images of two stamps need to be aligned for comparison, but this is very problematic because the image differs in placement, size, and rotation. Next, unequal paper shrinkage causes large variation in the print size of each stamp. Third, there is significant spatial variation in scanning resulting from both mechanical variations in the moving parts of the scanner, as well as distortions and imperfections in the scanning hardware and optics. Fourth, slight differences in the stamp color introduce additional variation in the digital data. Lastly, there is microscopic variation in the creation of a digital image, depending upon the alignment of the stamp’s details with the optical sensing elements.
While this set of difficulties is formidable, it is not insurmountable. It has proved possible to develop a method which gives reasonable and reproducible subtraction of high resolution images. This method provides a new and unanticipated way to investigate the detailed differences between stamp images, and even the printing plates themselves.
Method Investigation and Development
The first challenge in subtracting two high resolution stamp images is the alignment problem. Beginning with two similar sized stamps, a two-dimensional translation and a rotation are needed to align the two images. It is important to note that this alignment will be approximate, given the finer differences expected throughout the images.
Two approaches were evaluated for this “first-order” alignment of the images. One approach is a direct computational mapping of one to another, representing the stamp images as nearly-rectangular trapezoids. Another approach is a mapping consisting of three parameters, x, y, and 2, where x and y are horizontal and vertical translations, and 2 is a rotation. This second approach requires optimization and has the disadvantage of being computationally intensive. Both approaches were found to be useful in certain applications.
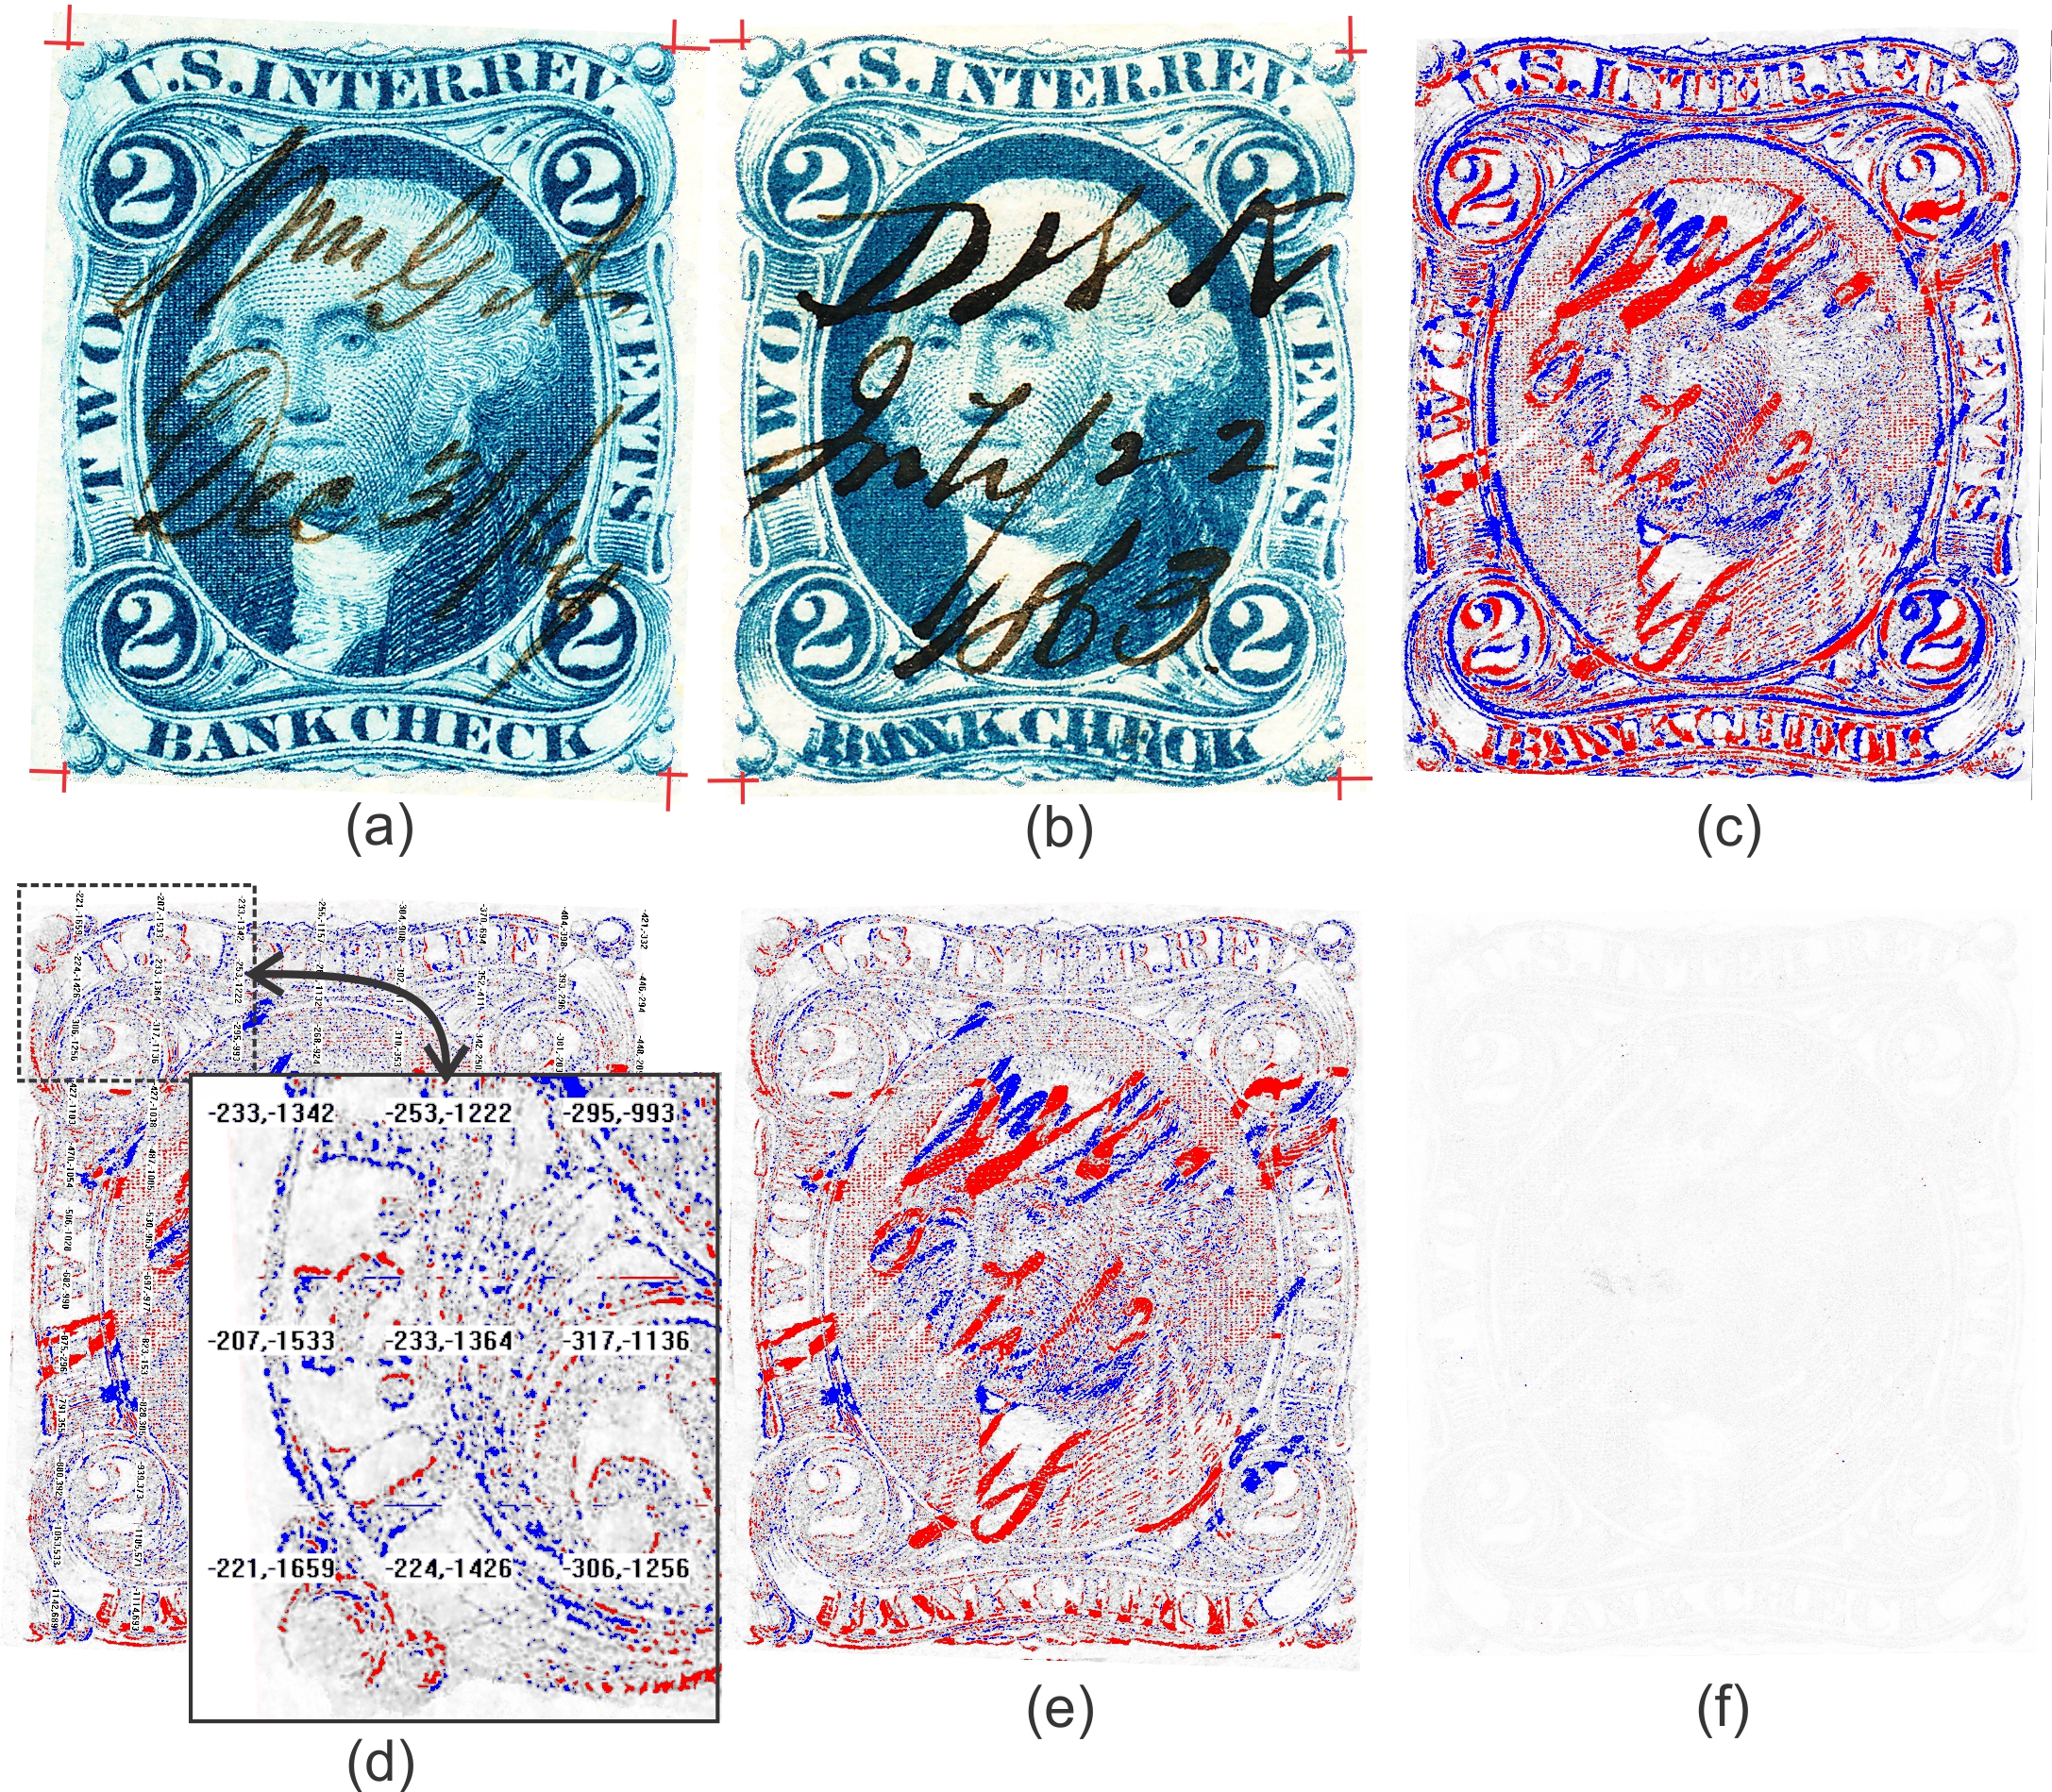
In the trapezoidal mapping approach, the accurate determination of the four corners of each stamp allows a parametric description, in which a grid varies proportionally along each edge. This provides a direct bilinear mapping from one image to the other. The new pixel coordinates from the mapping will not coincide with the existing pixels of the image being mapped into, but instead must be interpolated to the existing pixel positions. There are a number of interpolation routines to choose from; the widely-used bicubic interpolation (Keys, 1981) was used in this research. The quality of this trapezoidal mapping is very dependent on the accurate determination of the four corner positions, typically defined by the outer border of the design of most stamps. Close examination of a high resolution image[3] will raise an immediate concern because the printing is somewhat irregular along the stamp edges at high resolution, especially near the corners of stamp borders. To circumvent this problem, all images are analyzed from the edges inward to locate the color transitions from unprinted to printed paper that define the borders of the stamp design. This search along the length of each edge creates an array of points that is least-squares fit to a straight line along each border of the design. [4] The intersections of these four lines then define the four virtual corners of the stamp. Figures 1(a) and 1(b) illustrate this process for the blue Bank Check Documentary revenue stamp of the U.S. First Issue. The four cross-hairs show the virtual corners for the bordered design of the stamp. The stamp in Figure 1(b) has a re-entry feature in which bottom edge features have been duplicated by the transfer roll in producing the printing plate. [5]
Figure 1. The sequence of image processing steps for subtraction is illustrated above for the comparison of the First Issue blue Bank Check Documentary revenue stamp and its “T5” re-entry. The re-entry shown in (b) is visible in the doubling of features and lettering at the bottom of the stamp. A brief description of the steps: (a) A 1200 dpi high contrast image analyzed from all four edges inward to find the outer edges of the design and fit lines to the edges; the intersections of the four lines result in the cross-hair patterns to accurately determine the corners; (b) the process repeated with an image of the T5 re-entry; (c) the eight corners provide an estimate of the centering and rotation for launching an optimization procedure to align the images; a gray-scaled image shows the subtraction with false coloring in blue or red if the differences are greater than a threshold; (d) local alignment corrections are determined for each of 96 equal sections in this example; the inset shows an expanded view of the (x,y) pairs of correction shifts for each section; these values are in hundredths of a pixel; (e) the final subtraction including the corrections from (d); and (f) the subtraction of two entirely different scans of the stamp shown in (a) leaves only a faint ghost arising from small differences from sources such as scanning and interpolation.
The first-order alignment by translation and rotation was optimized using the Nelder-Mead (“simplex”) method (Nelder and Mead, 1965). The optimization seeks the minimum of the sum of the absolute differences of all of the pixels. Optimization calculations used interpolation, but the method steps always started with raw image file data. Appendix A provides a detailed description of the calculations. Simplex optimization benefits greatly from good initial value
estimates. The averages of the four virtual corners provide estimates for the image centers, and the difference between these positions gives initial estimates for the translations. The rotation
angle, 2, is estimated from the sets of slopes for the stamp borders. This approach has consistently converged to a reasonable optimum mapping. Evidently, the high resolution images of stamps are sufficiently similar that this approach works very well.
Figure 1(c) shows the image differencing following this first-order alignment by simplex optimization. Images for this research are either 8-bit gray scale images, or 24-bit RGB color images consisting of 8-bit red, green, and blue values for each pixel. The 8-bit gray scale differences are colored red or blue if the absolute value of the difference in pixel values is greater than a threshold set to 100, red if the value from the second stamp was greater than the first, and vice versa with the blue color.[6] In this case, the manuscript cancels unique to the first stamp appears in blue, and the cancel unique to the second stamp appears in red. Note that the image subtraction in Figure 1(c) shows substantial red and blue coloration, much of which originates from imperfect alignment, size differences, distortions, digital noise, color differences, and scanner imperfection.
To improve subtraction results over the first-order difference shown in Figure 1(c), it is necessary to seek smaller, second-order corrections to adjust for local distortions. These can originate from a variety of sources and are not expected to be homogeneous over the image. To determine these “second-order” corrections, the images were divided into many sections, and the subtraction of each section was re-optimized using the Nelder-Mead process. The first-order alignment of Figure 1(c) launched this re-optimization. Figure 1(d) shows the small, second-order adjustments determined using 96 equal sections (12 rows x 8 columns). The x and y second-order adjustments for each section are in units of hundredths of a pixel, and a portion of the image is enlarged for view. The images have resolutions of 1200 dpi, so a value of 100 on this scale corresponds to 1 pixel of shift, or about 21 µm. The sum of all of the shifts in the image in either direction is typically nearly zero because the first-order alignment process closely aligns the image centers. As a result, the second-order corrections tend to increase from the center out to the edges with opposite signs. The range of the second order corrections in this example is 2.50 pixel (53 µm) in the horizontal direction and 1.34 pixel (28 µm) in the vertical direction. In the event that a large image feature, such as a dominant re-entry, causes an anomalous shift in the second-order corrections, parabolic fits of the x and y shifts in both directions can adjust the values. This is seldom required, and has only been necessary for image sections with strong re-entry content that can create an additional local alignment possibility.
For the third and final subtraction of the images, the second-order corrections are interpolated over the image sections to locally adjust to the first-order mapping. The simplex optimization is next applied to a quadratic Bézier correction curve (Forrest, 1972) to correct for average color differences. Figure 1(e) shows the subtraction using the first-order mapping, the second-order adjustments, and the color adjustment. This subtraction is significantly improved over Figure 1(c). The lighter color is evidence of much better alignment and more complete subtraction of the images from each other. The remaining color highlights the major differences between the stamps. The strong T5 re-entry shows clearly in red at the bottom of the gray-scaled image difference, and more weakly along the left edge. The 24-bit color images give very similar results, [7] with the re-entry features visible in the original dark blue of the stamp. The 8-bit complement of the color difference in each channel does create some false coloring, but the color of the raw image file remains true where it is not subtracted, such as in the T5 re-entry at the bottom of the stamp. Similarly, the manuscript ink colors are true to the original stamps where not coincidentally overlapping and subtracting from each other. While 24-bit color and 8-bit gray scale approaches give very similar results, the 8-bit images with thresholded, false coloring shown in Figures 1(c)-1(e) give more vivid results for most images with smaller file sizes and somewhat faster processing.
The residual background in Figure 1(e) has several contributing sources, including differences in pixilation, microscopic inking, scanner distortion, and paper distortion. It is therefore revealing to test the subtraction with other scans of the same stamp. To minimize the scanner’s contribution to errors in differencing, the second scan of the stamp in Figure 1(a) was collected in a similar, but slightly different, position on the platen.[8] In this case, most of the image is eliminated as shown in Figure 1(f). With the scanning contribution minimized in this way, the average of the absolute values of the second-order corrections was less than 0.02 pixels with a standard deviation of less than 0.01 pixel. This corresponds to only 0.4 μm ± 0.2 µm. Thus, the fine details of the stamp, such as microscopic inking variation, are faithfully captured in the both scans and subtracted away from each other.
The second-order corrections following trapezoidal mapping for the first-order alignment were found to be less centered than those obtained by optimizing alignment by translation and rotation. It appears that the use of the full images’ data and a centered initial estimate to start the simplex optimization provides a more consistently centered result. The local, second-order process is sufficiently robust to fully compensate for a less centered mapping, so the final subtractions are nearly identical for both first-order approaches. Because a well-centered first-order mapping provides some advantages for other analyses presented later in this article, the first-order alignment using simplex optimization is preferentially used for all of the data and discussion in the remainder of this article.
Examples of Image Differencing
While Figure 1 shows results using image differencing to examine a major re-entry, Figure 2 contains examples with more minute re-entries along the left edge of the 1898 2½ cent U.S. Proprietary revenue stamp. This figure shows the left edges of a reference stamp (Ref) and several stamps with re-entries (A-D). The same detail peculiar to this plate position is evident on all four stamps as seen by the repeating pattern of the red highlights on the left edge and elsewhere on the stamps. It is important to use more than one reference stamp to correctly ascribe fine detail throughout the design to a particular plate position. Changing the reference stamp still reproduces these re-entry features; using a different reference stamp only changes fine detail in the image arising from microscopic differences in inking and a few larger flaws peculiar to the reference stamp.
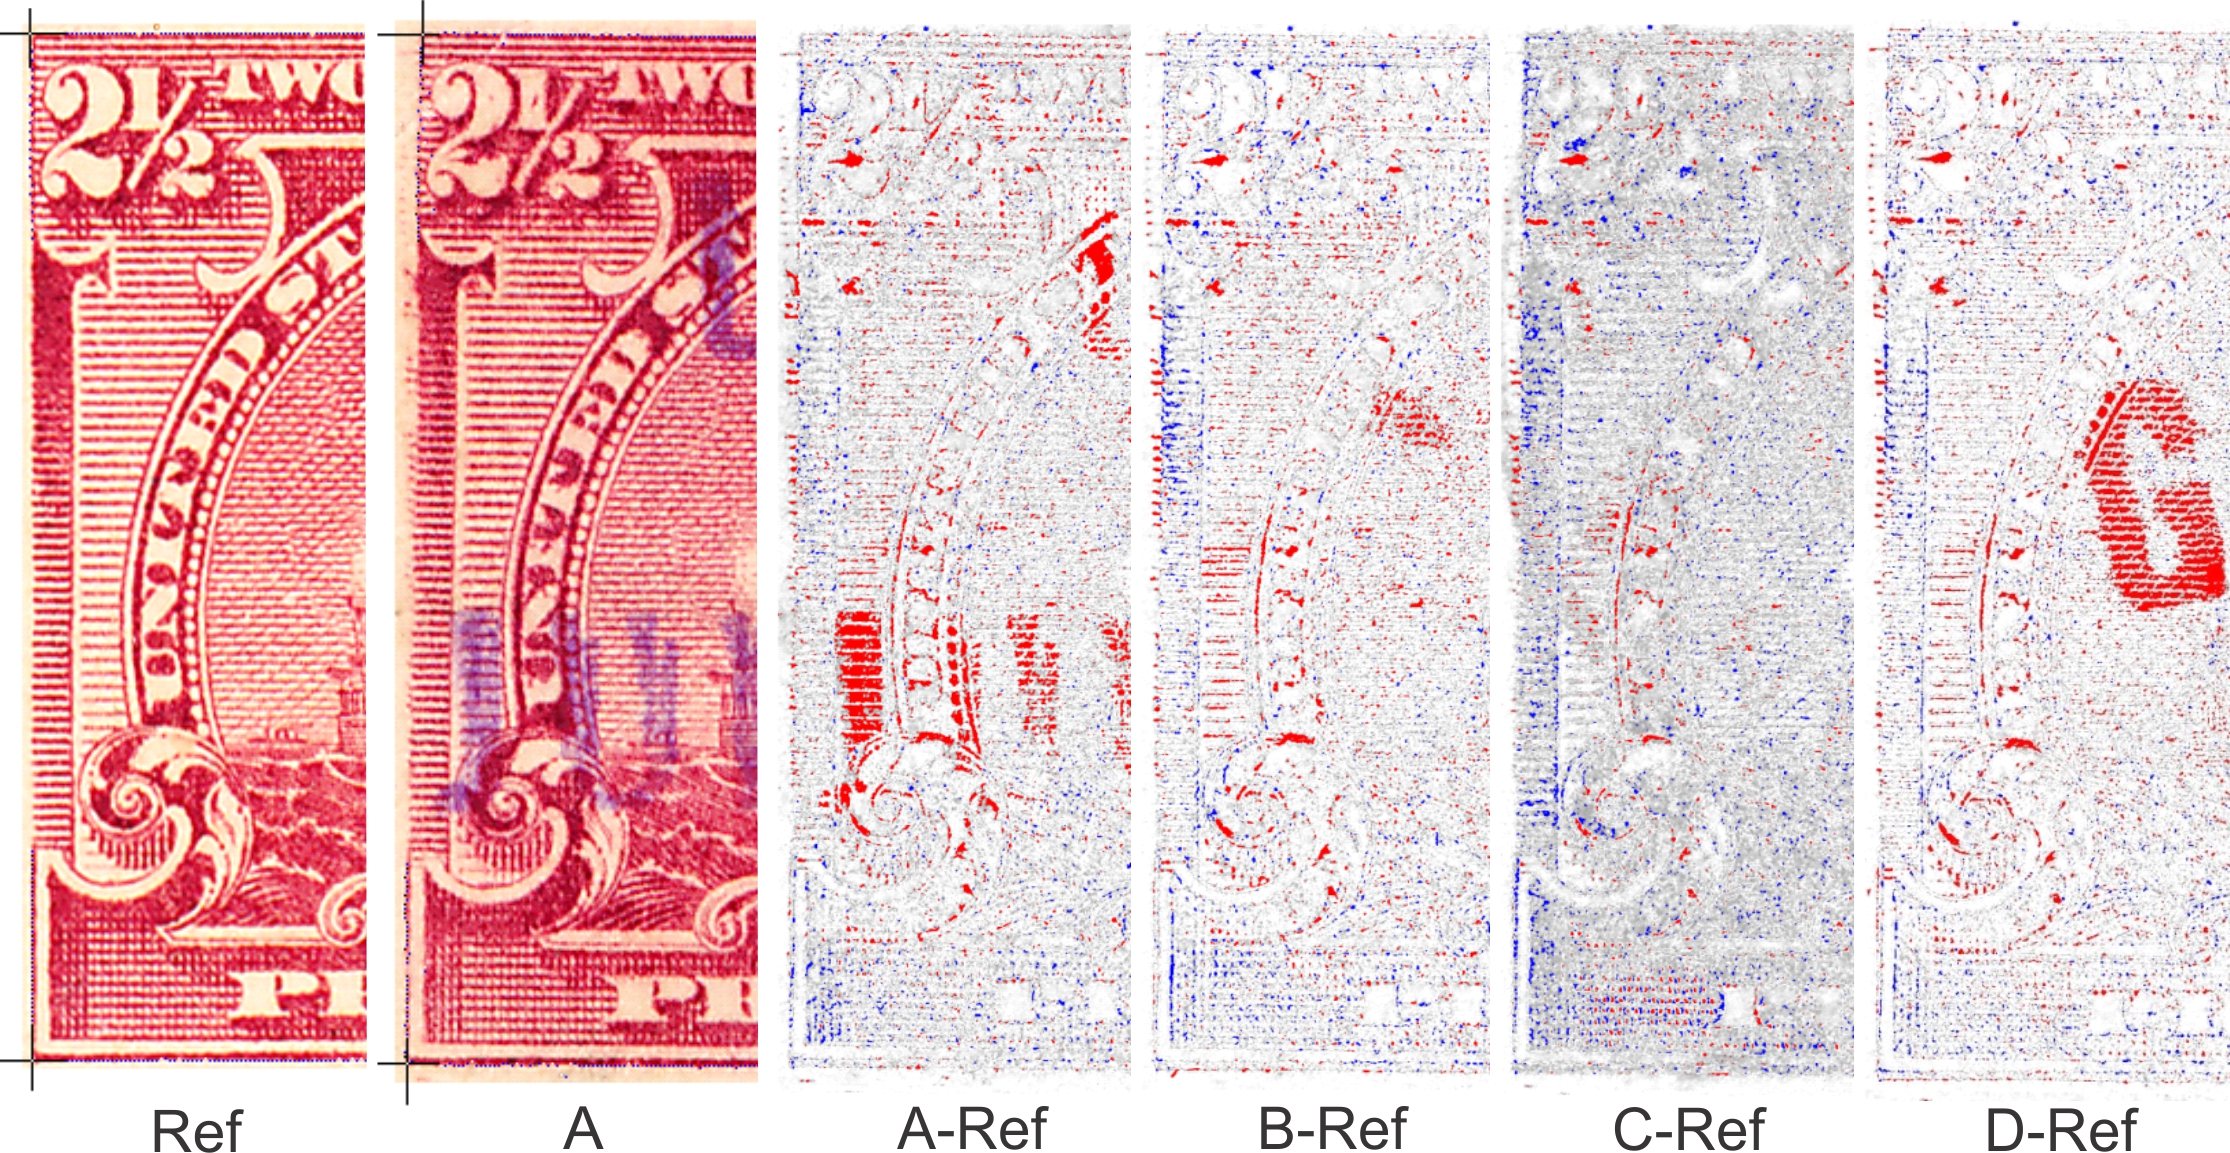
Figure 2. Image subtraction illustrated with four different examples, A-D, of a re-entry variety of the 2½ cent Proprietary revenue stamp of 1898. The left edges of the stamps are shown because the re-entries are most prominent along the left edge. The reference stamp (Ref) is at the far left and the re-entry ‘A’ is shown in color adjacent to it. The four differenced images in false-colored gray scale show matching re-entry patterns.
Figure 3 details three examples of the First Issue 15 cent Inland Revenue Documentary stamp with plate cracks near the top of the stamp after subtraction with reference stamp. While the plate cracks, indicated by arrows, are plainly visible near the top edge of the stamps in the original stamps, the subtraction makes the extension of the plate crack down into hair on the portrait visible on all three stamps. Only the middle stamp on the left shows this before the subtraction. The differencing also brings out poorly visible detail such as a fork in the cracks in the letter ‘E.’ In this example, 24-bit color image subtraction enhances the view of these faint features much better than thresholding, as in Figure 2, which can diminish the view of faint features.
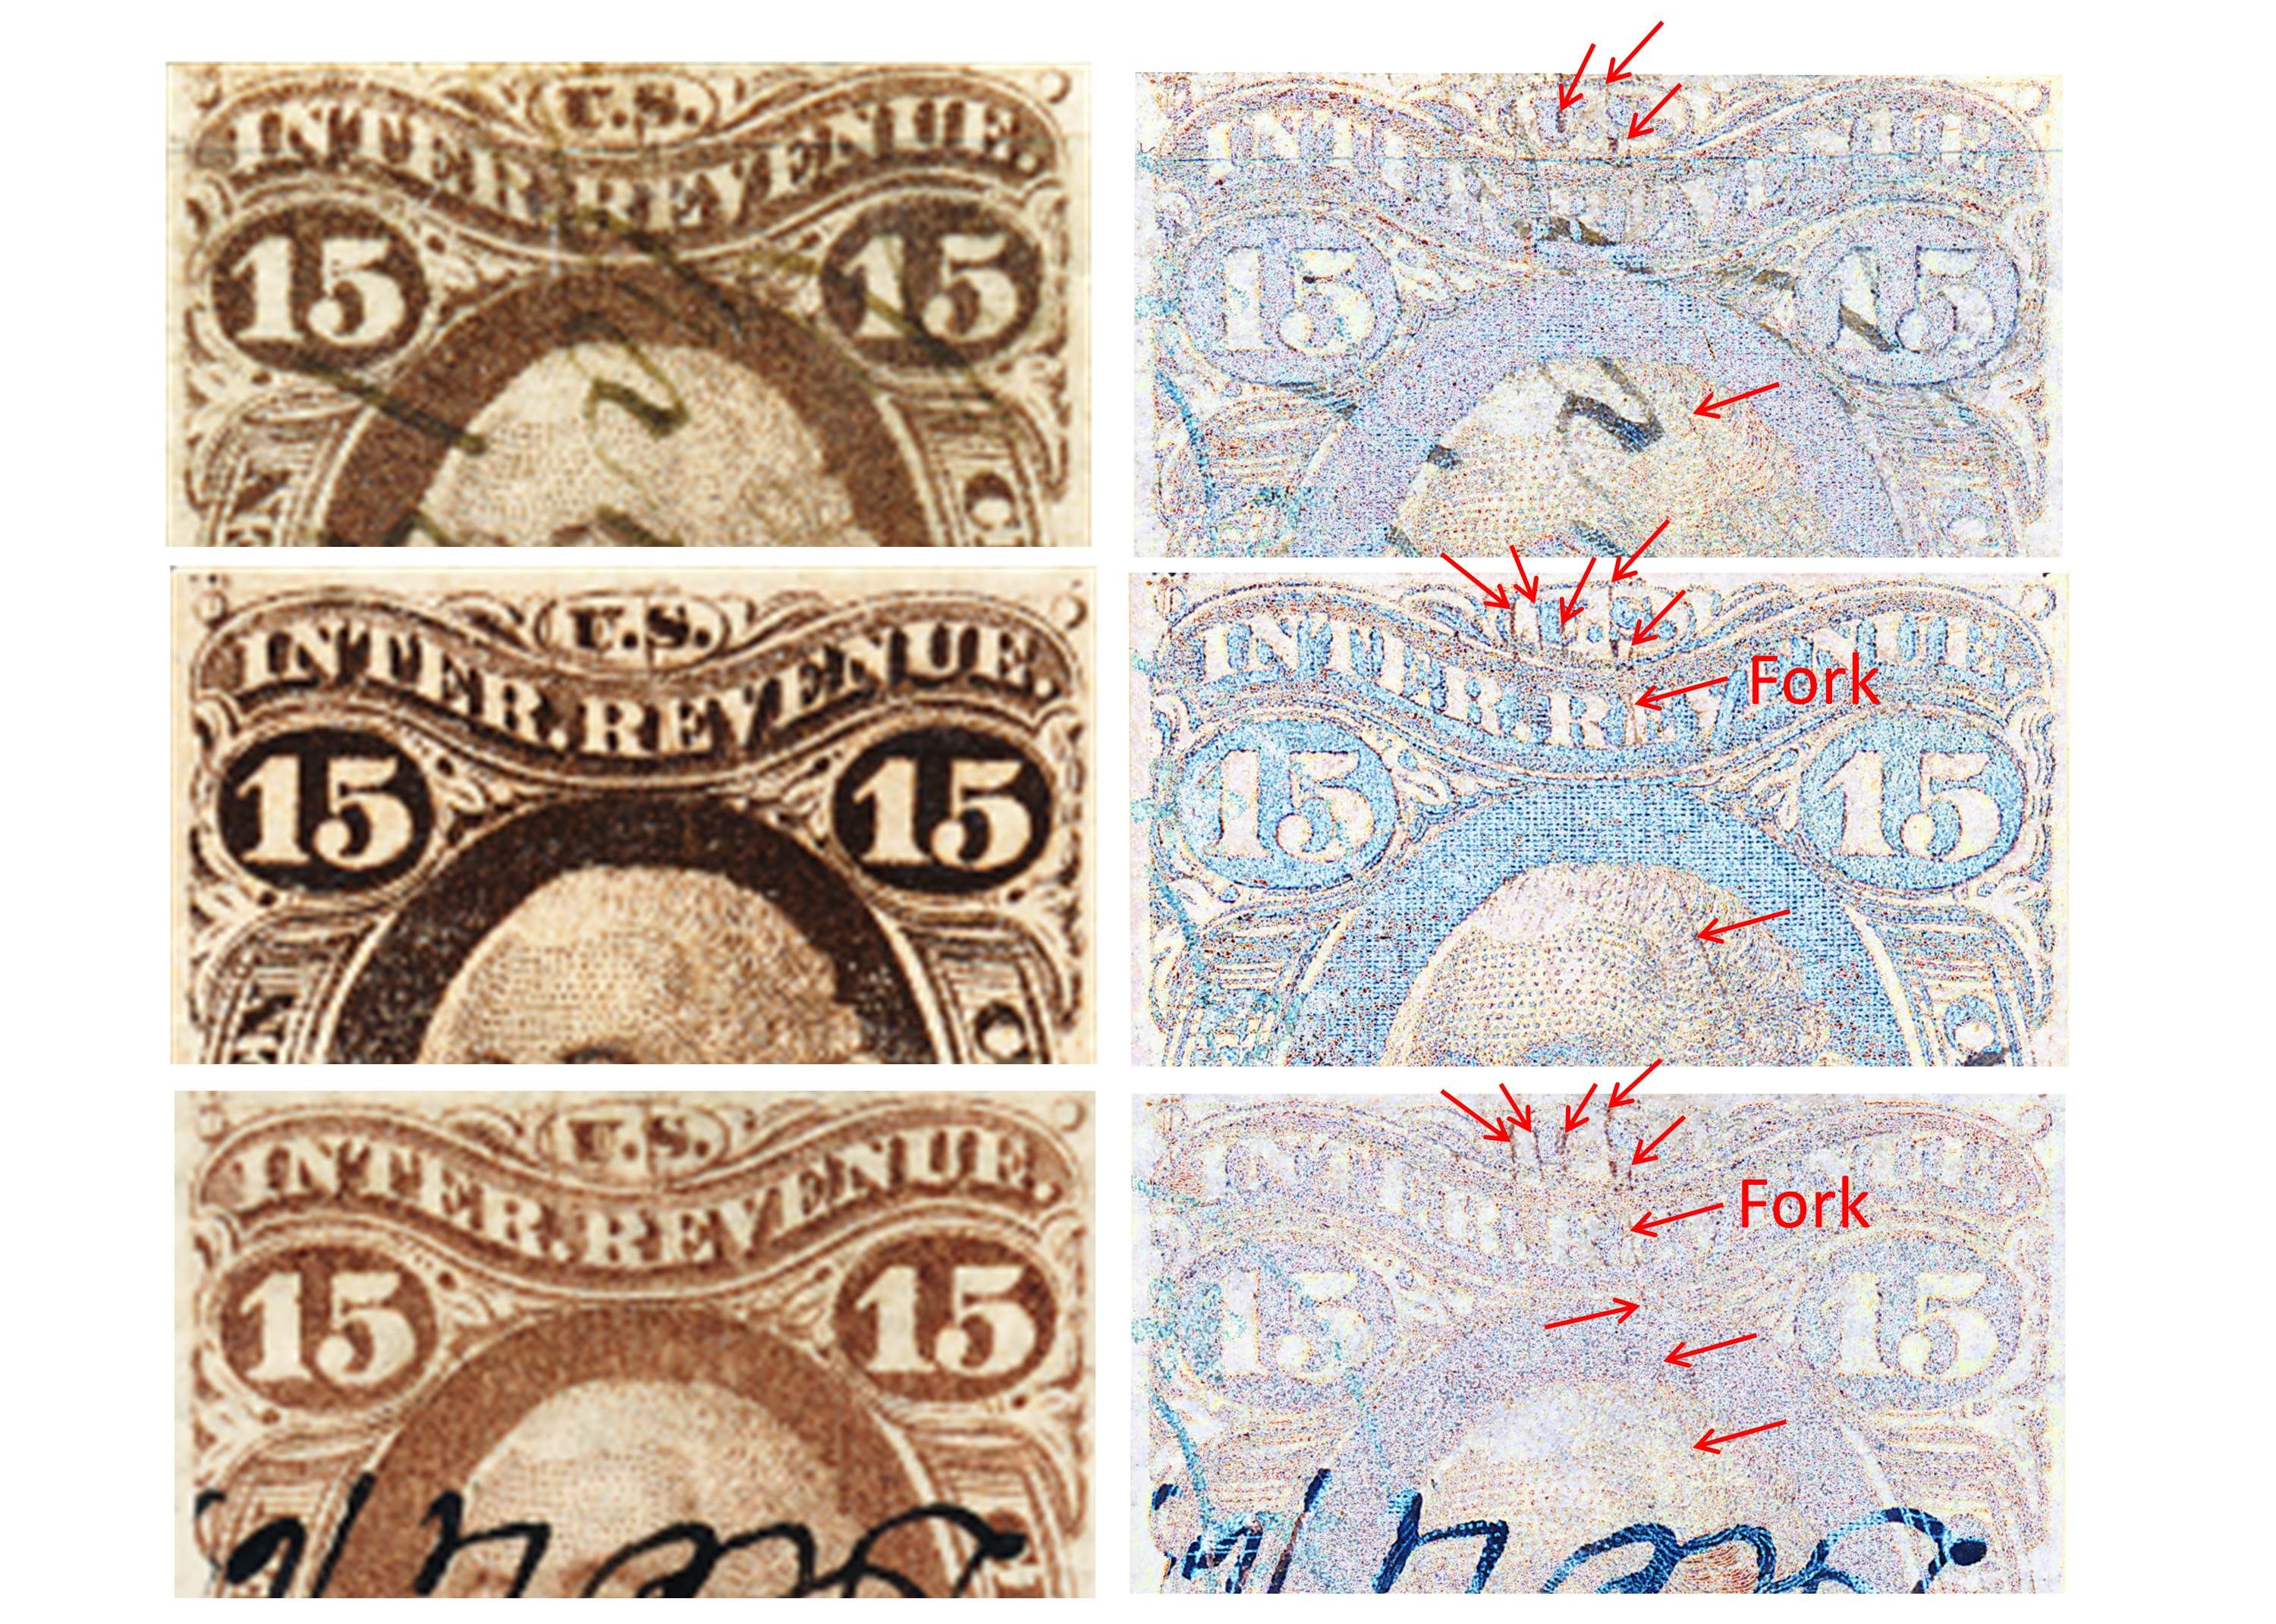
Figure 3. An example using subtraction to highlight poorly visible plate crack detail on the First Issue 15 cent Inland Revenue Documentary stamp. Since the features to be enhanced are faint, 24-bit color images are used instead of thresholded, false color images with gray scale. Views of the multiple cracks and a fork in the crack are significantly enhanced by the subtraction. The crack traversing the hair in the portrait is visible on all three stamps after subtraction.
A fourth example, Figure 4, shows image differencing with a group of lithographed stamps from Batum. The inking of these stamps is very uneven, typical of some lithographed stamps. Figure 4(a) shows the genuine type B for Batum #1 (Ceresa, 1993). The numerals were added on different occasions, as shown by the subtraction of this stamp with the genuine type C in Figure 4(b). The extensive inking differences result in a large amount of color speckled throughout the image. Despite this, the subtraction aligns all of the stamp design extremely well, with the exception of the numerals. Close alignment is especially evident in the white spaces in the design. Figure 4(c) shows the differencing of a pair of Batum #1 forgeries, types I and II (Ceresa, 1993). The subtraction shows these forgeries to be somewhat similar, but with extensive small shifts in design throughout. These many shifts result in the large amount of excess blue color along the edges of white spaces, and also in features such as the larger “KOA” letters. Figure 4(d) shows a more severe comparison, the subtraction of the Batum #1 genuine type B with the type II forgery. The many solid areas of color indicate major differences throughout, such as the dissimilar branching of the aloe trees.
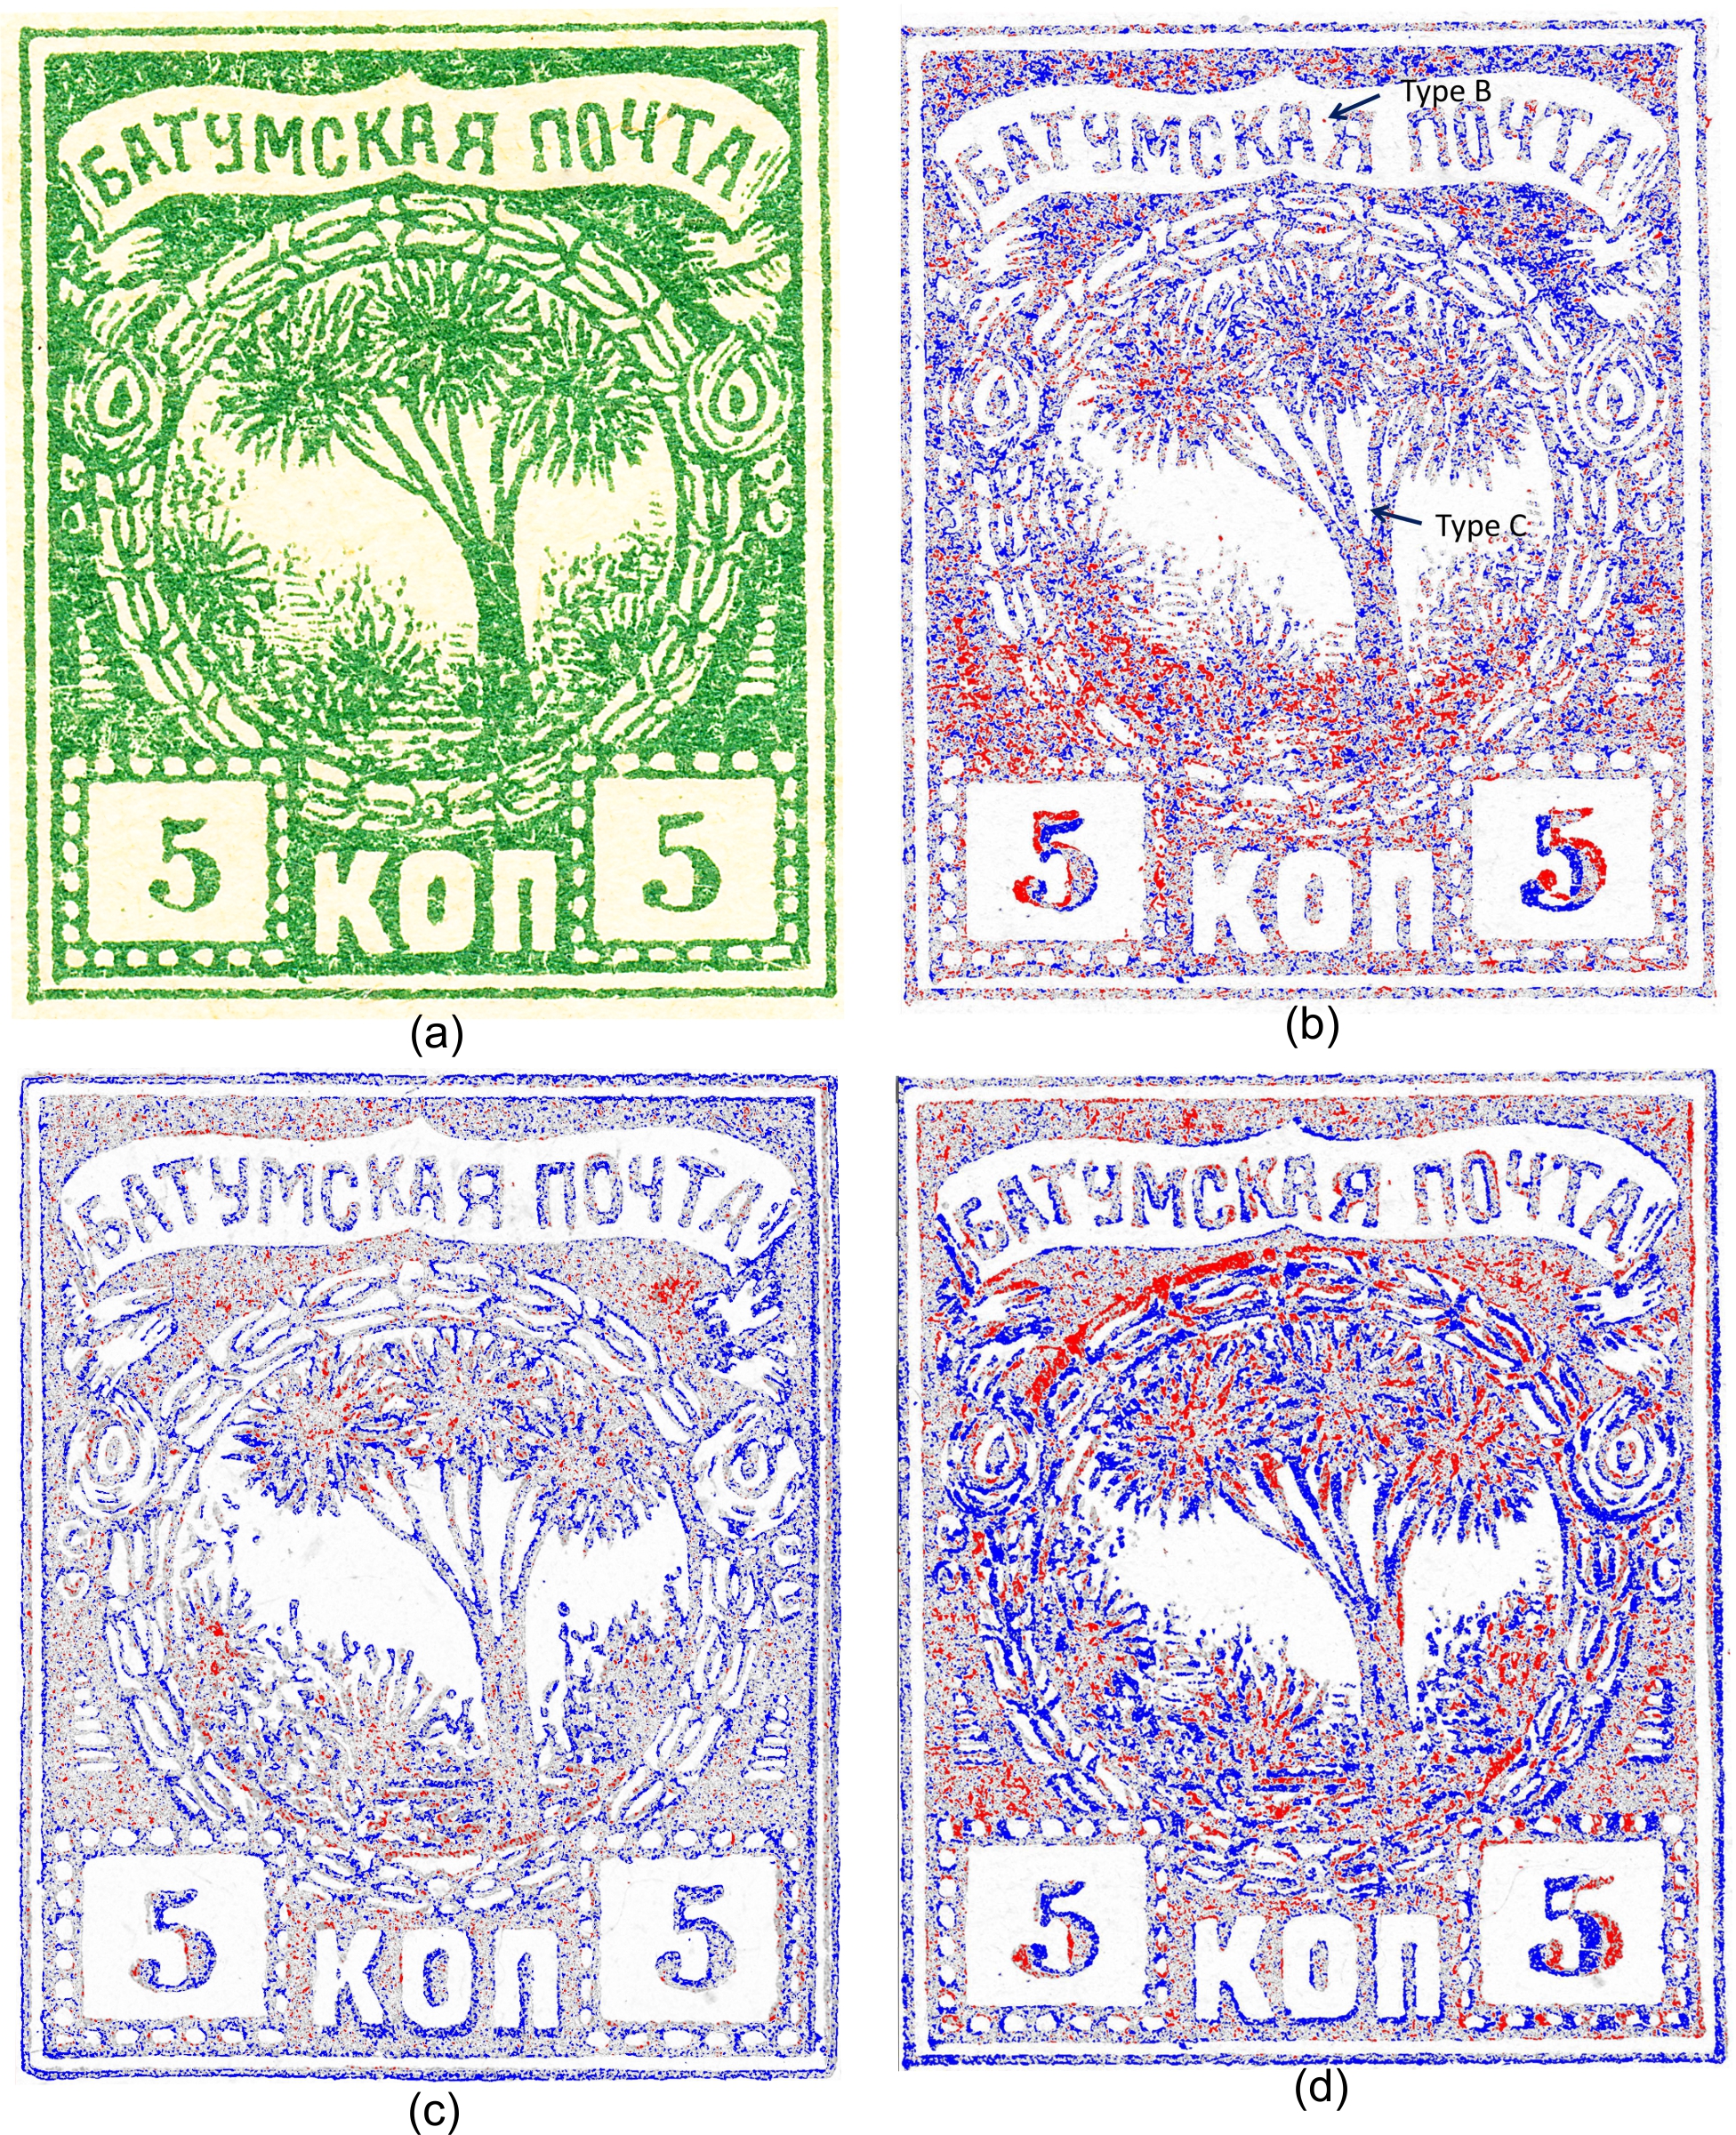
Figure 4. The differencing of images of genuine and forged stamps of early Batum. (a) shows the genuine type B for Batum #1. The subtraction of (a) with a genuine type C of the same stamp results in image (b). There is substantial noise from uneven inking in the production of the lithographs, but the alignment is very good apart from the differing numeral entries for the two types. The subtraction of the types I and II forgeries produces (c) which has differences everywhere. The subtraction of the type II forgery with the genuine type B in (a) produces the image in (d) which has large differences throughout.
These examples demonstrate the power of this new image subtracting method to compensate for a variety of distortions and enhance the detailed view of fine differences between stamps. The results with the multiple examples of re-entries show strong consistency even though the stamps have slightly different sizes. The plate crack examples show the ability to more clearly see faint features in images of poorly printed stamps. The ability to make global comparisons of the differences in variably inked stamps is well demonstrated by the Batum #1 lithographed stamps. Despite a large amount of speckle created by inking differences, the similarities and differences of the overall designs are clearly evident and are visualized in their entirety. The large differences between the genuine and forged Batum #1 stamps that extend over their entirety demonstrate the robustness of the method in its ability to distinguish differences between images.
Further Study of the Second-Order Corrections
The preceding figures illustrate that this new, second-order correction process provides a greatly improved comparison of two stamp images to highlight detailed differences. This section of the article explores what these second-order corrections can tell us about ordinary stamps without significant flaws. Do the small, second-order corrections reveal any general information about regular stamps? Or are they only inconsistencies unique to each pair of stamps? The second option would seem more likely because significant distortions occur due to differences in paper shrinkage and scanner variability. The second order corrections consist of a large grid of x and y corrections, as shown in Figure 1(d). Consequently, the study of a large number of comparisons between multiple stamps involves a data intensive investigation of many numerical grids with results that can be difficult to visualize. For this reason, we will now switch from illustrations of stamps to a graphical visualization of grids of these second order corrections. We will use shaded contour plots for this purpose. These are most familiar from their use in topographical maps. In these contour mappings, the lowest correction value is assigned the color black and the highest correction value is given the color white. The contours represent steps in these values in a table ranging between the two extremes and are shaded accordingly. Thus, a medium gray shade represents the middle of the range of values in the grid. Every set of second-order corrections results in two different contour plots, one for the x values and one for the y values. The physical meaning is a simple one – the contours show the relative movement of each area of the stamp required for the fine alignment of the images. For the x contour plots, dark shades have a small shift to the left, while light shades have a small shift to the right. For the y contour plots, dark shades correspond to upward movement, while light shades show downward movement. Since the range of second-order corrections is 1-3 pixels, the contour plots show ranges of movement of about 20-60 µm.
How much image variability is due to the scanner, and what can be done to limit this variability? The dimensional accuracy of the scanner used in this research was measured to be better than 0.01% in the horizontal direction (Mustacich, 2014), a factor of approximately 20x better than the vertical direction. This is thought to be a consequence of the more complex mechanics of vertical scanning, which involves gears, belts, and backlash issues, compared to the horizontal scan direction, which is more dependent on just the optics and stability to displacement or to wobble (Poliakow et al., 2007). The spatial variability of the Canon 9000F flatbed scanner was investigated by scanning images of the same stamp in a variety of locations on the platen and then using subtraction to monitor changes in the second-order corrections. Not surprisingly, changing platen positions caused large variations in the second-order corrections. However, if nearly the same platen position was used, manually repositioning the stamp to ensure a non-identical scan, then the second-order corrections remained relatively constant. Importantly, using nearly the same platen position on the scanner also gives consistent second-order corrections in the subtraction of different stamps from each other.
A scanning protocol was therefore established to maintain repeatability of the second-order corrections. In this protocol a paper mask on the platen guided the placement of the stamps to achieve nearly the same position for all scans. This mask consisted of an 8.5 x 11 inch sheet of cardstock with four rectangular holes for viewing and positioning the edges of the stamp underneath the cardstock. The cardstock registers to the upper right corner of the platen; Figure 5 shows a photo of the corner stamp of a block positioned using the mask. The perforations of three edges of the corner stamp are lined up just outside the edges of the center area of the mask.
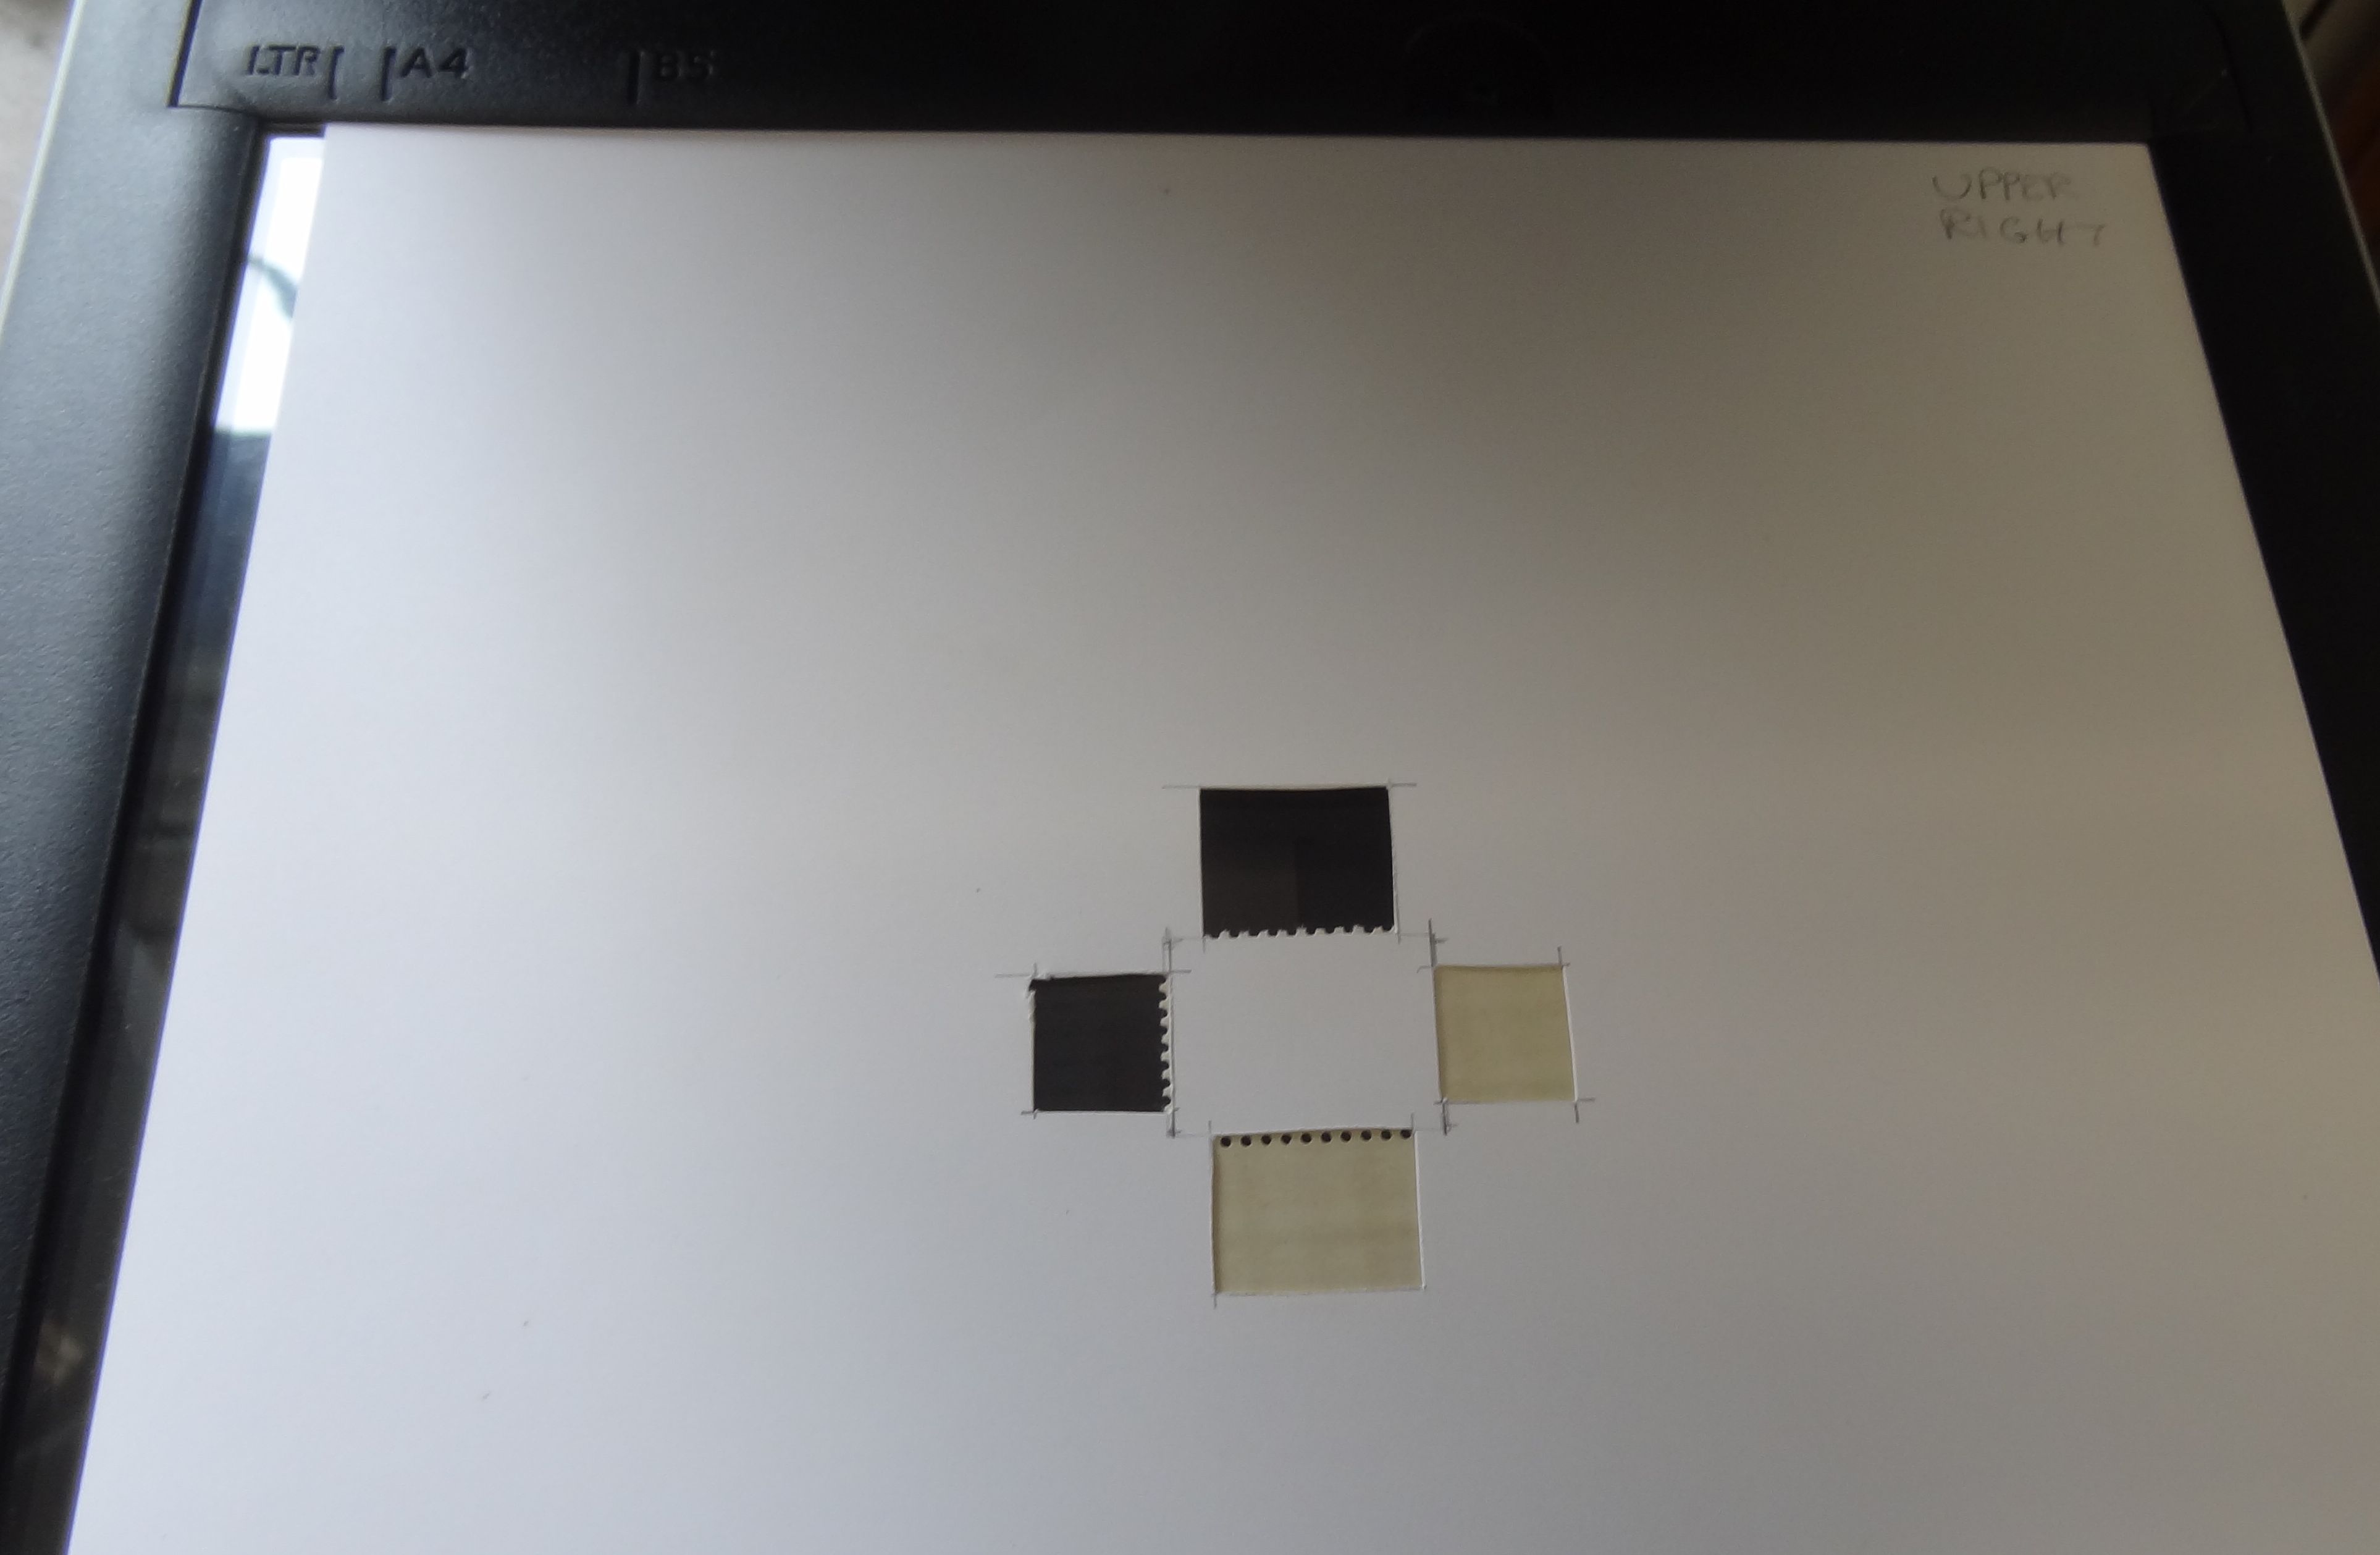
Figure 5. Mask on scanner for aligning stamps for repeated use of the same position on the platen.
Testing deliberate placement variation with this mask showed that 1.5 mm misalignments had very little effect on the second-order corrections. Less misalignment than this is easily achieved with the mask. The standard deviation of the absolute values of the differences in second-order corrections for the 96 image sections are less than 0.03 pixels over this 3 mm range of horizontal alignments. At 1200 dpi a pixel corresponds to ~ 21 µm, so the deviation is less than 1 µm using this mask. The second-order corrections show very small gradients, which are approximately uniform in a single direction, and these gradients appear to vary with platen position. This suggests that these small gradients may be systematic distortion in the scanner. All images in the remainder of this article were obtained by scanning with this mask to minimize contribution to the second-order corrections by the scanner.
Image manipulations in pre-processing or in the subtraction calculations are also a potential source of error and increased noise. This was demonstrated by applying a sequence of three small rotations of less than 1 degree chosen so that the sum of the three unequal rotations was a zero rotation, and then comparing the subtractions of the resulting image and the starting image with a reference image. The series of rotations introduced increases of 10% or more to the sum of the pixel differences between the images in the optimized subtractions. For this reason, image pre-processing steps that involve interpolation such as resizing or rotation were avoided. Interpolation is used only for computational purposes in the optimizations and for visualization of the final subtraction result. First-order, second-order, and Bézier color corrections are accumulated and applied in aggregate to the raw image files as described in Appendix A. In other words, the raw image files are never modified.
Avoiding interpolative pre-processing and using the scanning mask protocol, Figure 6 shows the subtraction of a pair of plate blocks, stamp by stamp, of the same plate position. [9] This block was a lower right (LR) plate #26003 of the ½ cent 1953 dry-printed Franklin stamp. The subtraction of the two blocks reveals similar and approximately uniform large gradients in both the horizontal and vertical directions. For the x (horizontal) correction contours in the center block, the dark shades show a shift to the left and the white shades a shift to the right. This shows a relative horizontal expansion of all of the stamps in one block relative to the other block of stamps. The y corrections show the same relative expansion in the vertical direction. The range of these second-order corrections is 1-2 pixels, or approximately 20-40 µm. This result shows a significant size difference between the plate blocks. If the blocks were identical, the contour images would be uniformly mid-gray. The overall uniformity of the gradients would be consistent with a difference in post-printing paper shrinkage between the sheets. It should be noted that the dry printing process for these stamps still involves wetting to about 5-10% additional water by weight (Faries, 1982), so the paper expansion can be substantial.
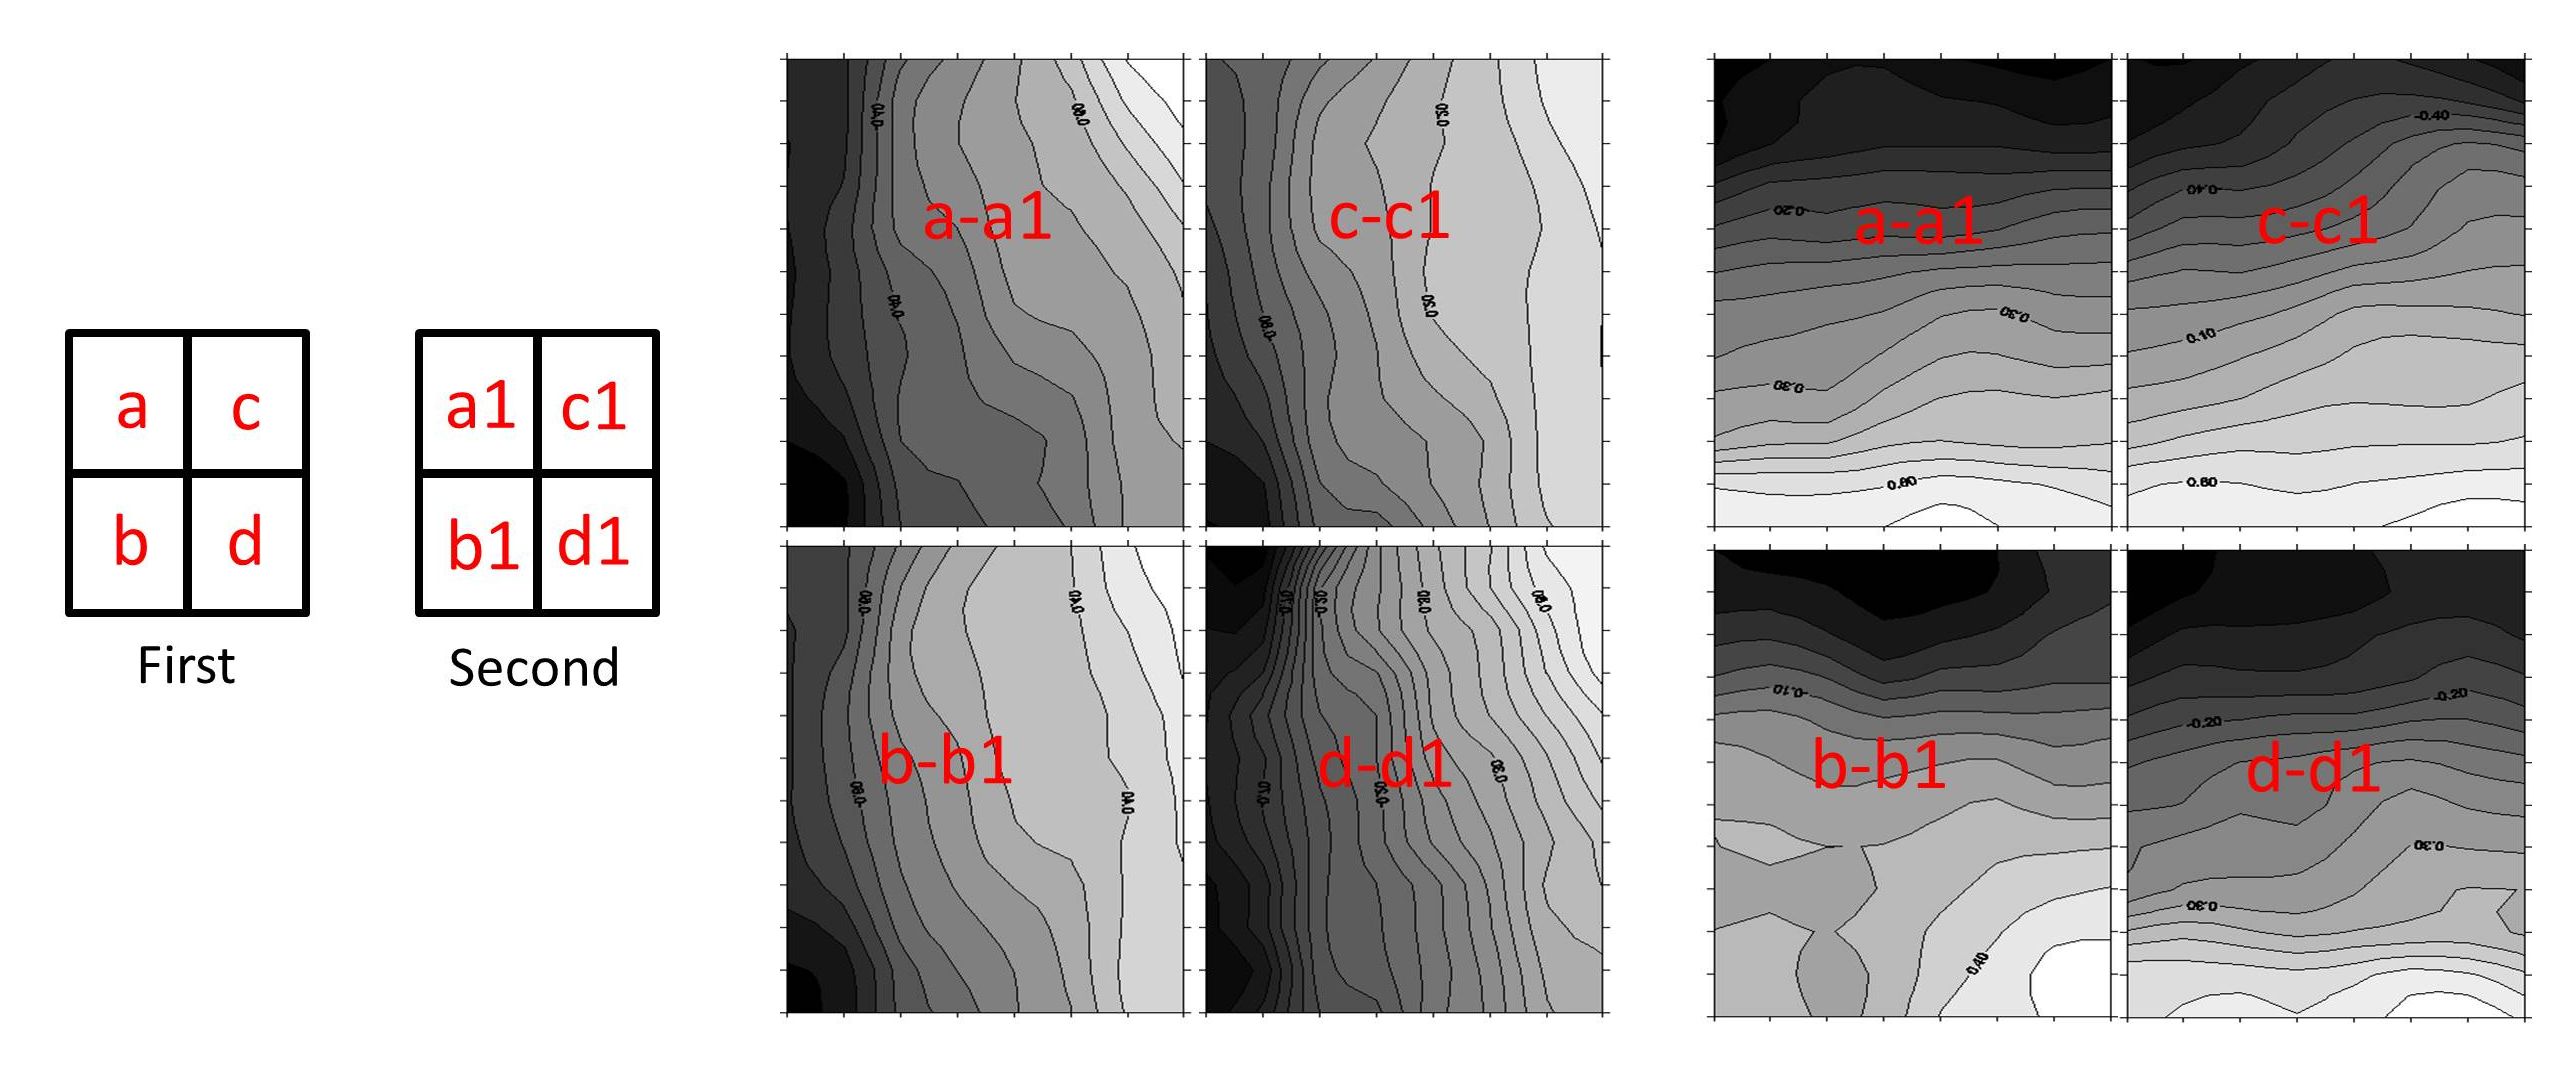
Figure 6. Image differencing of two same-number (#26003), same-plate position (LR) plate bocks of the ½ cent 1953 dry-printed Franklin stamp. Large and relatively uniform gradients in the x component displayed as shaded contour plots are shown in the center, and for the y component at the right. These large gradients are the expected result of large differences in shrinkage between the sheets following printing.
Comparing wet-printed stamps of the same issue using LR #25263 plate position blocks provides a similar result, but with somewhat less uniform gradients of 2-3 pixels, or approximately 40-60 μm of distortion difference. Wet printing involves typical water uptake of 15-30% by the paper (Faries, 1982), and can be subject to greater shrinkage after printing. These results suggest that subtraction of the same plate positions simply exhibit large differences from paper shrinkage after printing. This is consistent with the differences of several pixels in comparing the stamp design sizes using the four virtual corners. In fact, before paper shrinkage was fully appreciated in philately, there was an erroneous belief that in some cases stamps were printed from more than one set of plates, or plates were made from dies of different sizes (Williams and Williams, 1971).
Measurements of paper expansion and shrinkage of a lower right #25981 block of the ½ cent 1953 Franklin stamp showed that the stamp can expand about 1% or more in both directions when wet. [10] Water uptake was measured with an analytical balance, and size was measured by the virtual corner positions in the differencing software. These changes amount to 200-300 µm. It becomes obvious that differences in paper shrinkage, comparing any two sheets of the same stamp, contribute significantly to inconsistencies in the images under microanalysis.
In order to avoid this shrinkage-caused distortion, stamps were next compared within a single sheet. Since the entire sheet would have undergone a relatively uniform wetting and shrinking, we hoped to find more image consistency. To explore this possibility we selected one stamp in each of two blocks and subtracted from those the images of the other three stamps in the block. Figure 7 shows an example of this intra-sheet differencing using a pair of LR #26003 ½ cent 1953 Franklin plate blocks. The stamp positions in the block are labeled a to d, and the images of stamps b through d were subtracted from the image of a resulting in a set of three contour plots for the second-order corrections for both blocks. Comparing the side-by-side results for the two blocks shows a remarkable similarity for the same position differences. For example, comparing the two “a-c” contour plots in the top of Figure 7 shows that both have small values (black) left of center and at the middle of the bottom edge. Both have large values (white) at the bottom right side, and larger values also on the corners on the left side. The upper right corners in the left plot have a small region of black and white near each other, while the right plot has an average value (a neutral gray). The gross overall features are well repeated in comparing the contour plots of the two blocks, although the upper “a-b” plot for the second block has a shallower low value near the center. This general result can be repeated with different choices of stamps in the block to result in entirely different contour patterns specific to each position that are very similar between the two blocks.
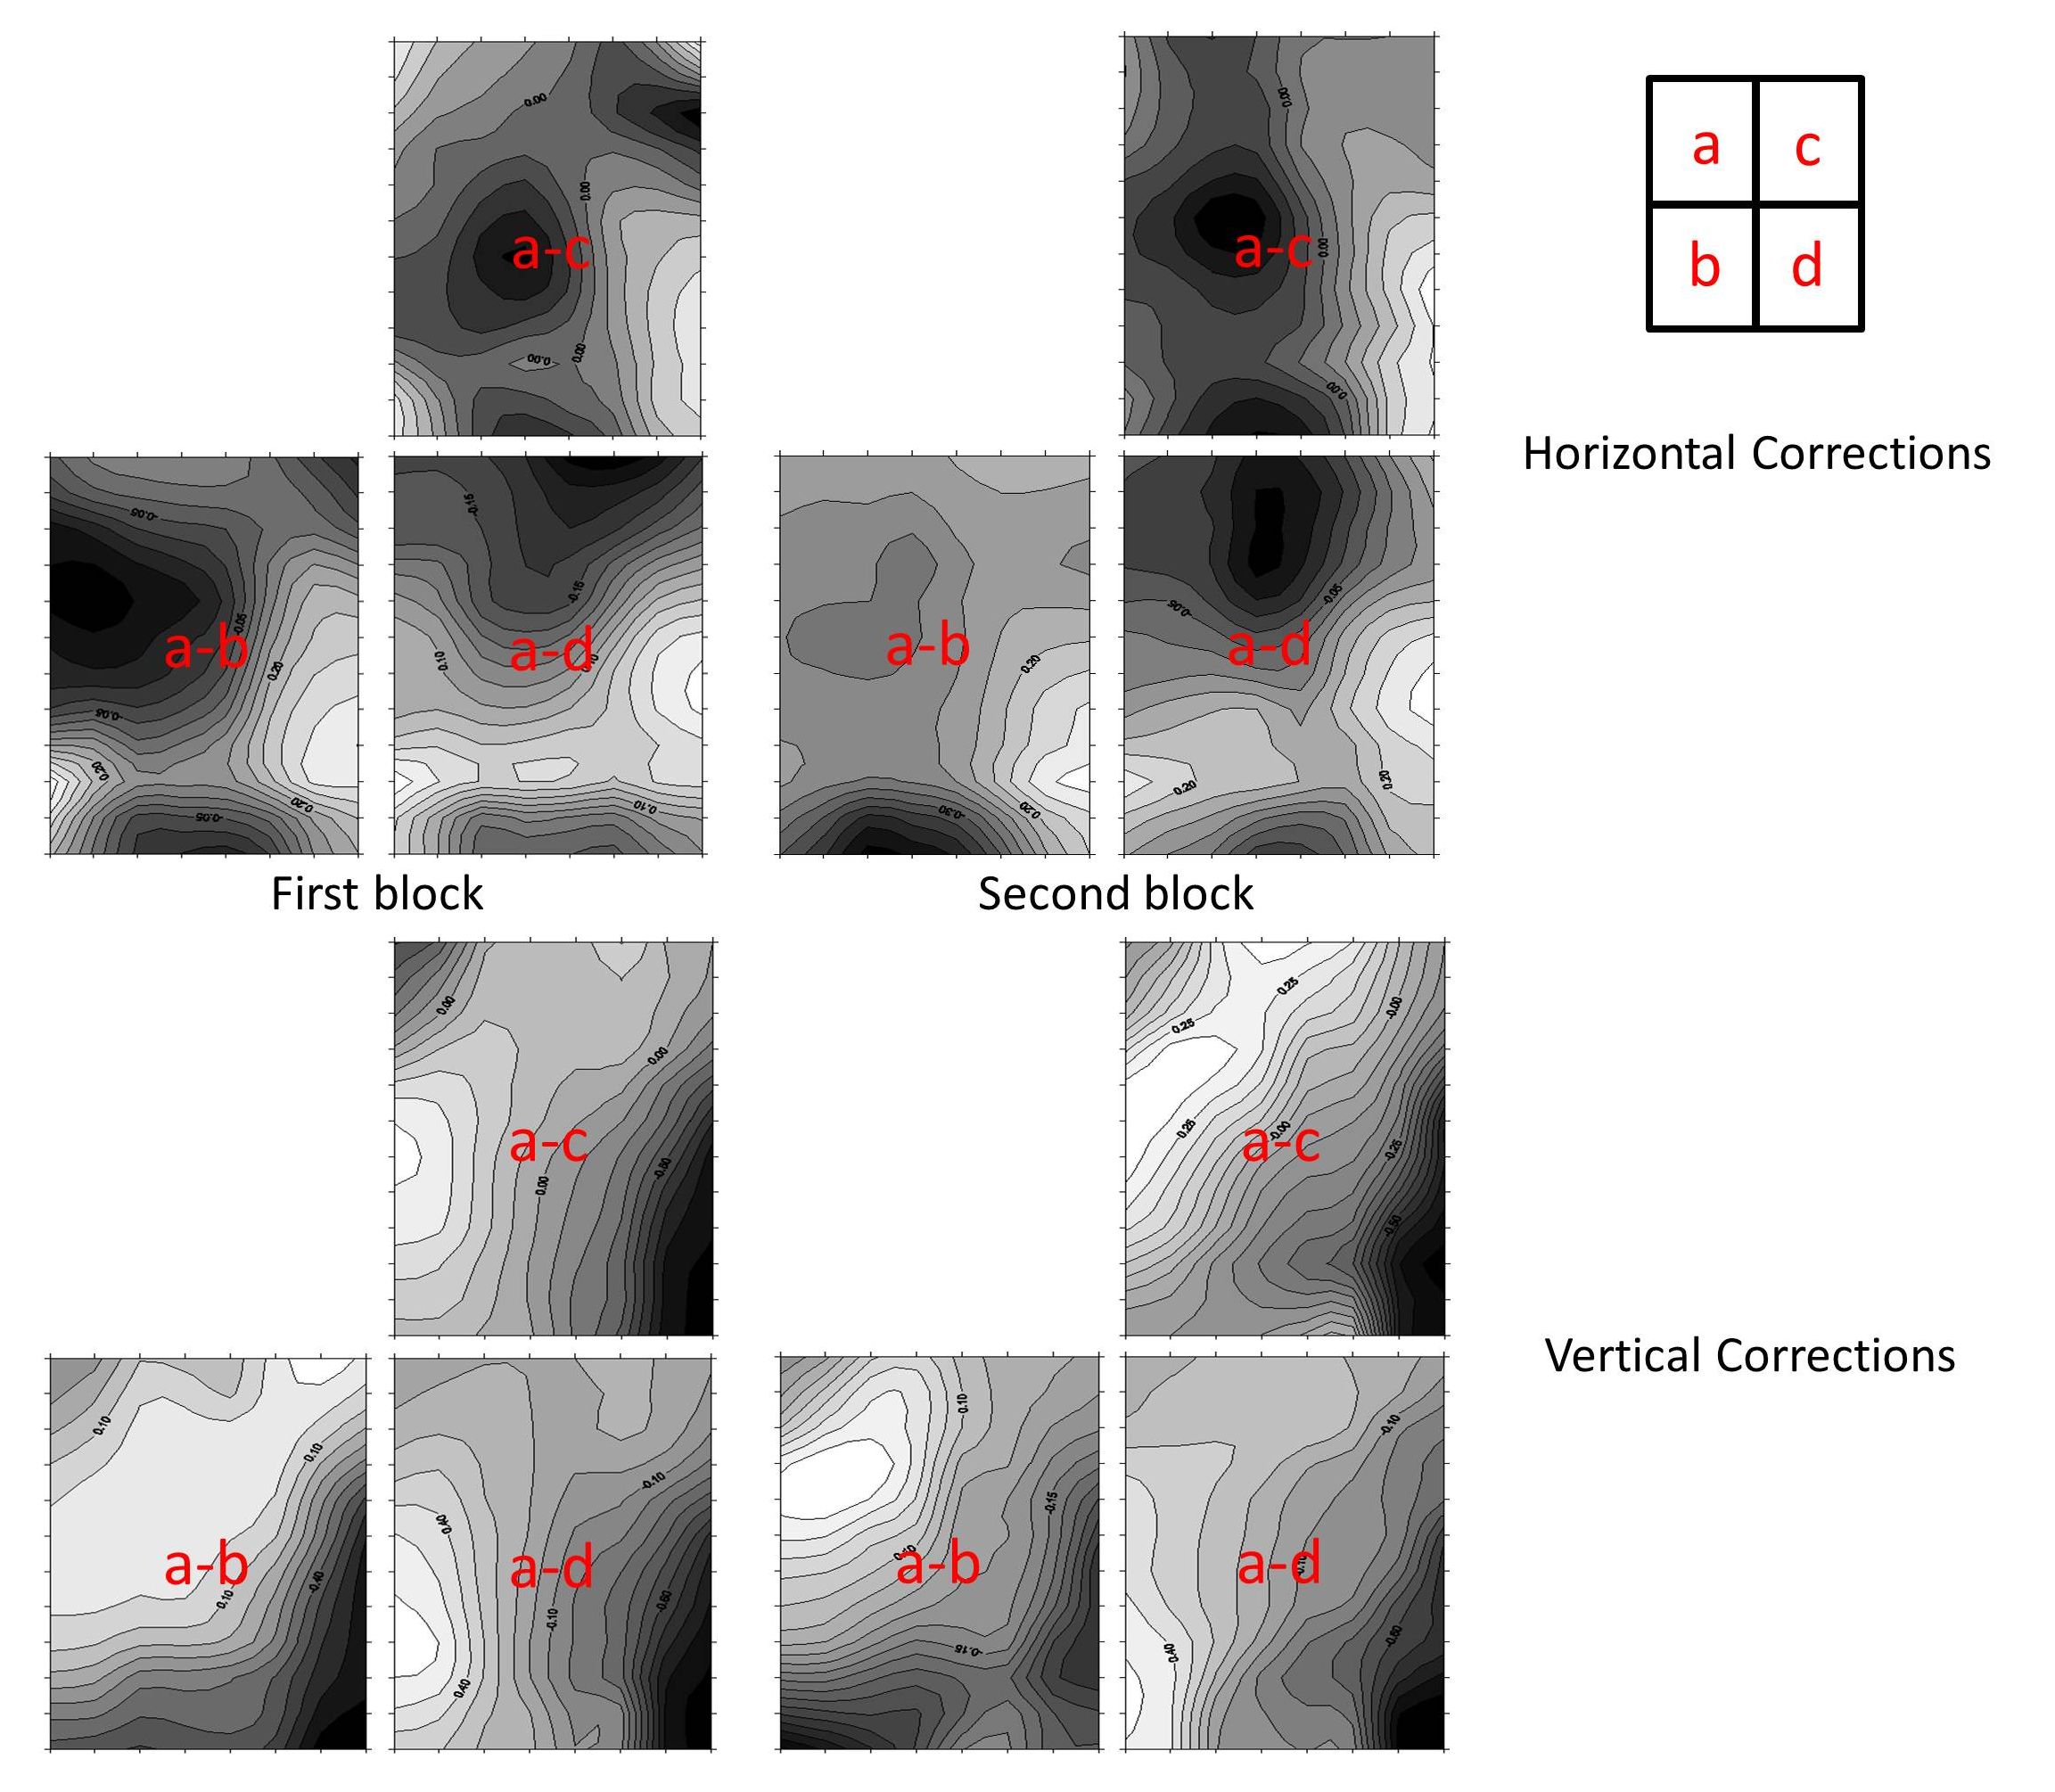
Figure 7. Intra-plate differencing of the stamps in same plate block, in this case subtracting all positions from stamp a. Repeating with a second block of the same plate number and position gave very similar results suggesting that intra-plate comparisons may be relatively independent of the post-printing shrinkage.
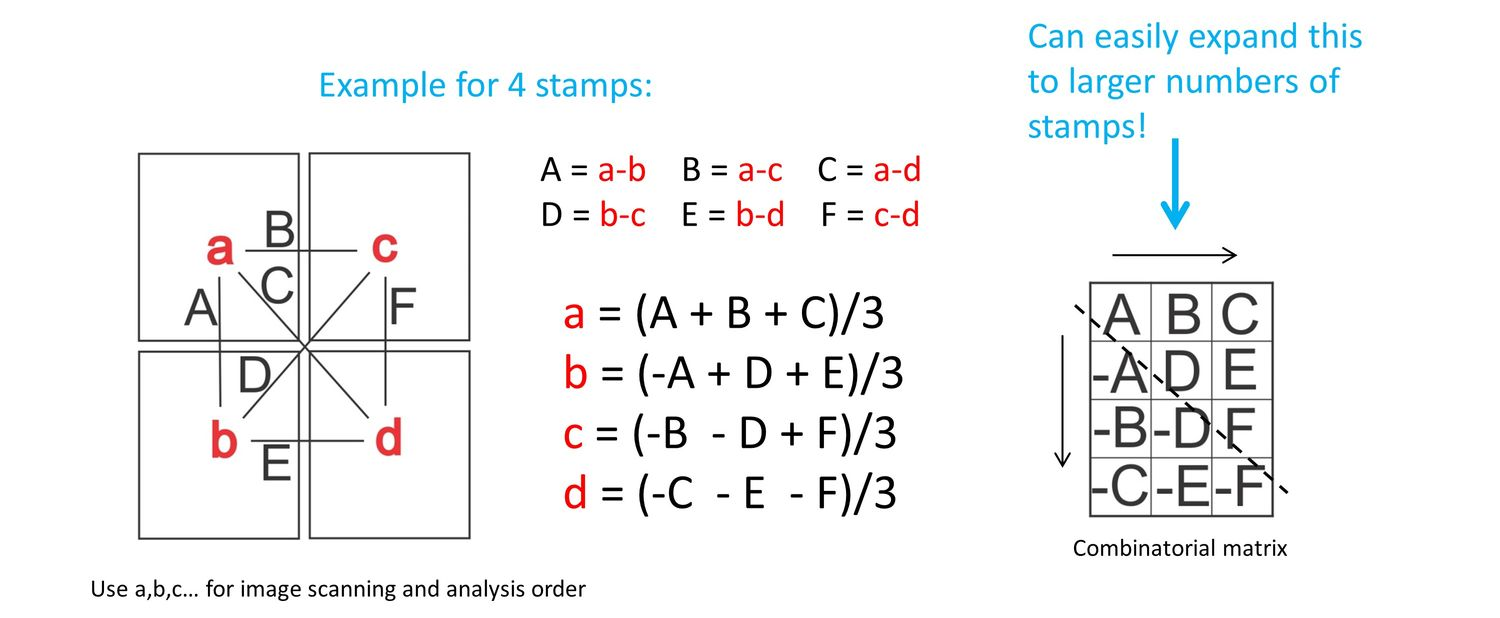
Each of the four sets of three contour plots in Figure 7 can be averaged together to estimate an inherent pattern for the stamp in the a position. This pattern for the a position represents how the second-order corrections for stamp a compare with the average of the corrections for the other stamps. With four stamps there are six possible image subtractions, and different combinations of these subtractions provide estimates for how the other three stamps differ from the average. Appendix A describes the combinations used to create these estimates. Using more stamps provides more averaging and should make these estimates more reliable. Nonetheless, using just the four stamps of each block in Figure 7 gives very similar patterns when comparing the two blocks.
The repeatability of this result was explored further with a set of ten same plate position blocks of LR #25981 ½ cent dry-printed 1953 Franklin stamps. Combinations of intra-block image differences were used to estimate the relative patterns at each position. Figure 8 shows together the ten results for the horizontal component of each position for direct comparison. The similarities of the distortion patterns are extraordinary, although the tenth block was without gum and is slightly different from the others. In comparing all of the a position results, for example, the low values (black) are strongest in the upper right and spread horizontally across the plots, while the large values (white) are bottom and top. The results are similarly consistent in comparing the vertical components for these relative patterns. These patterns are much larger and very different from the micron size and relatively uniform gradients produced by the scanner, and are intermediate in size to the large gradients observed with direct inter-sheet comparisons as in Figure 6.
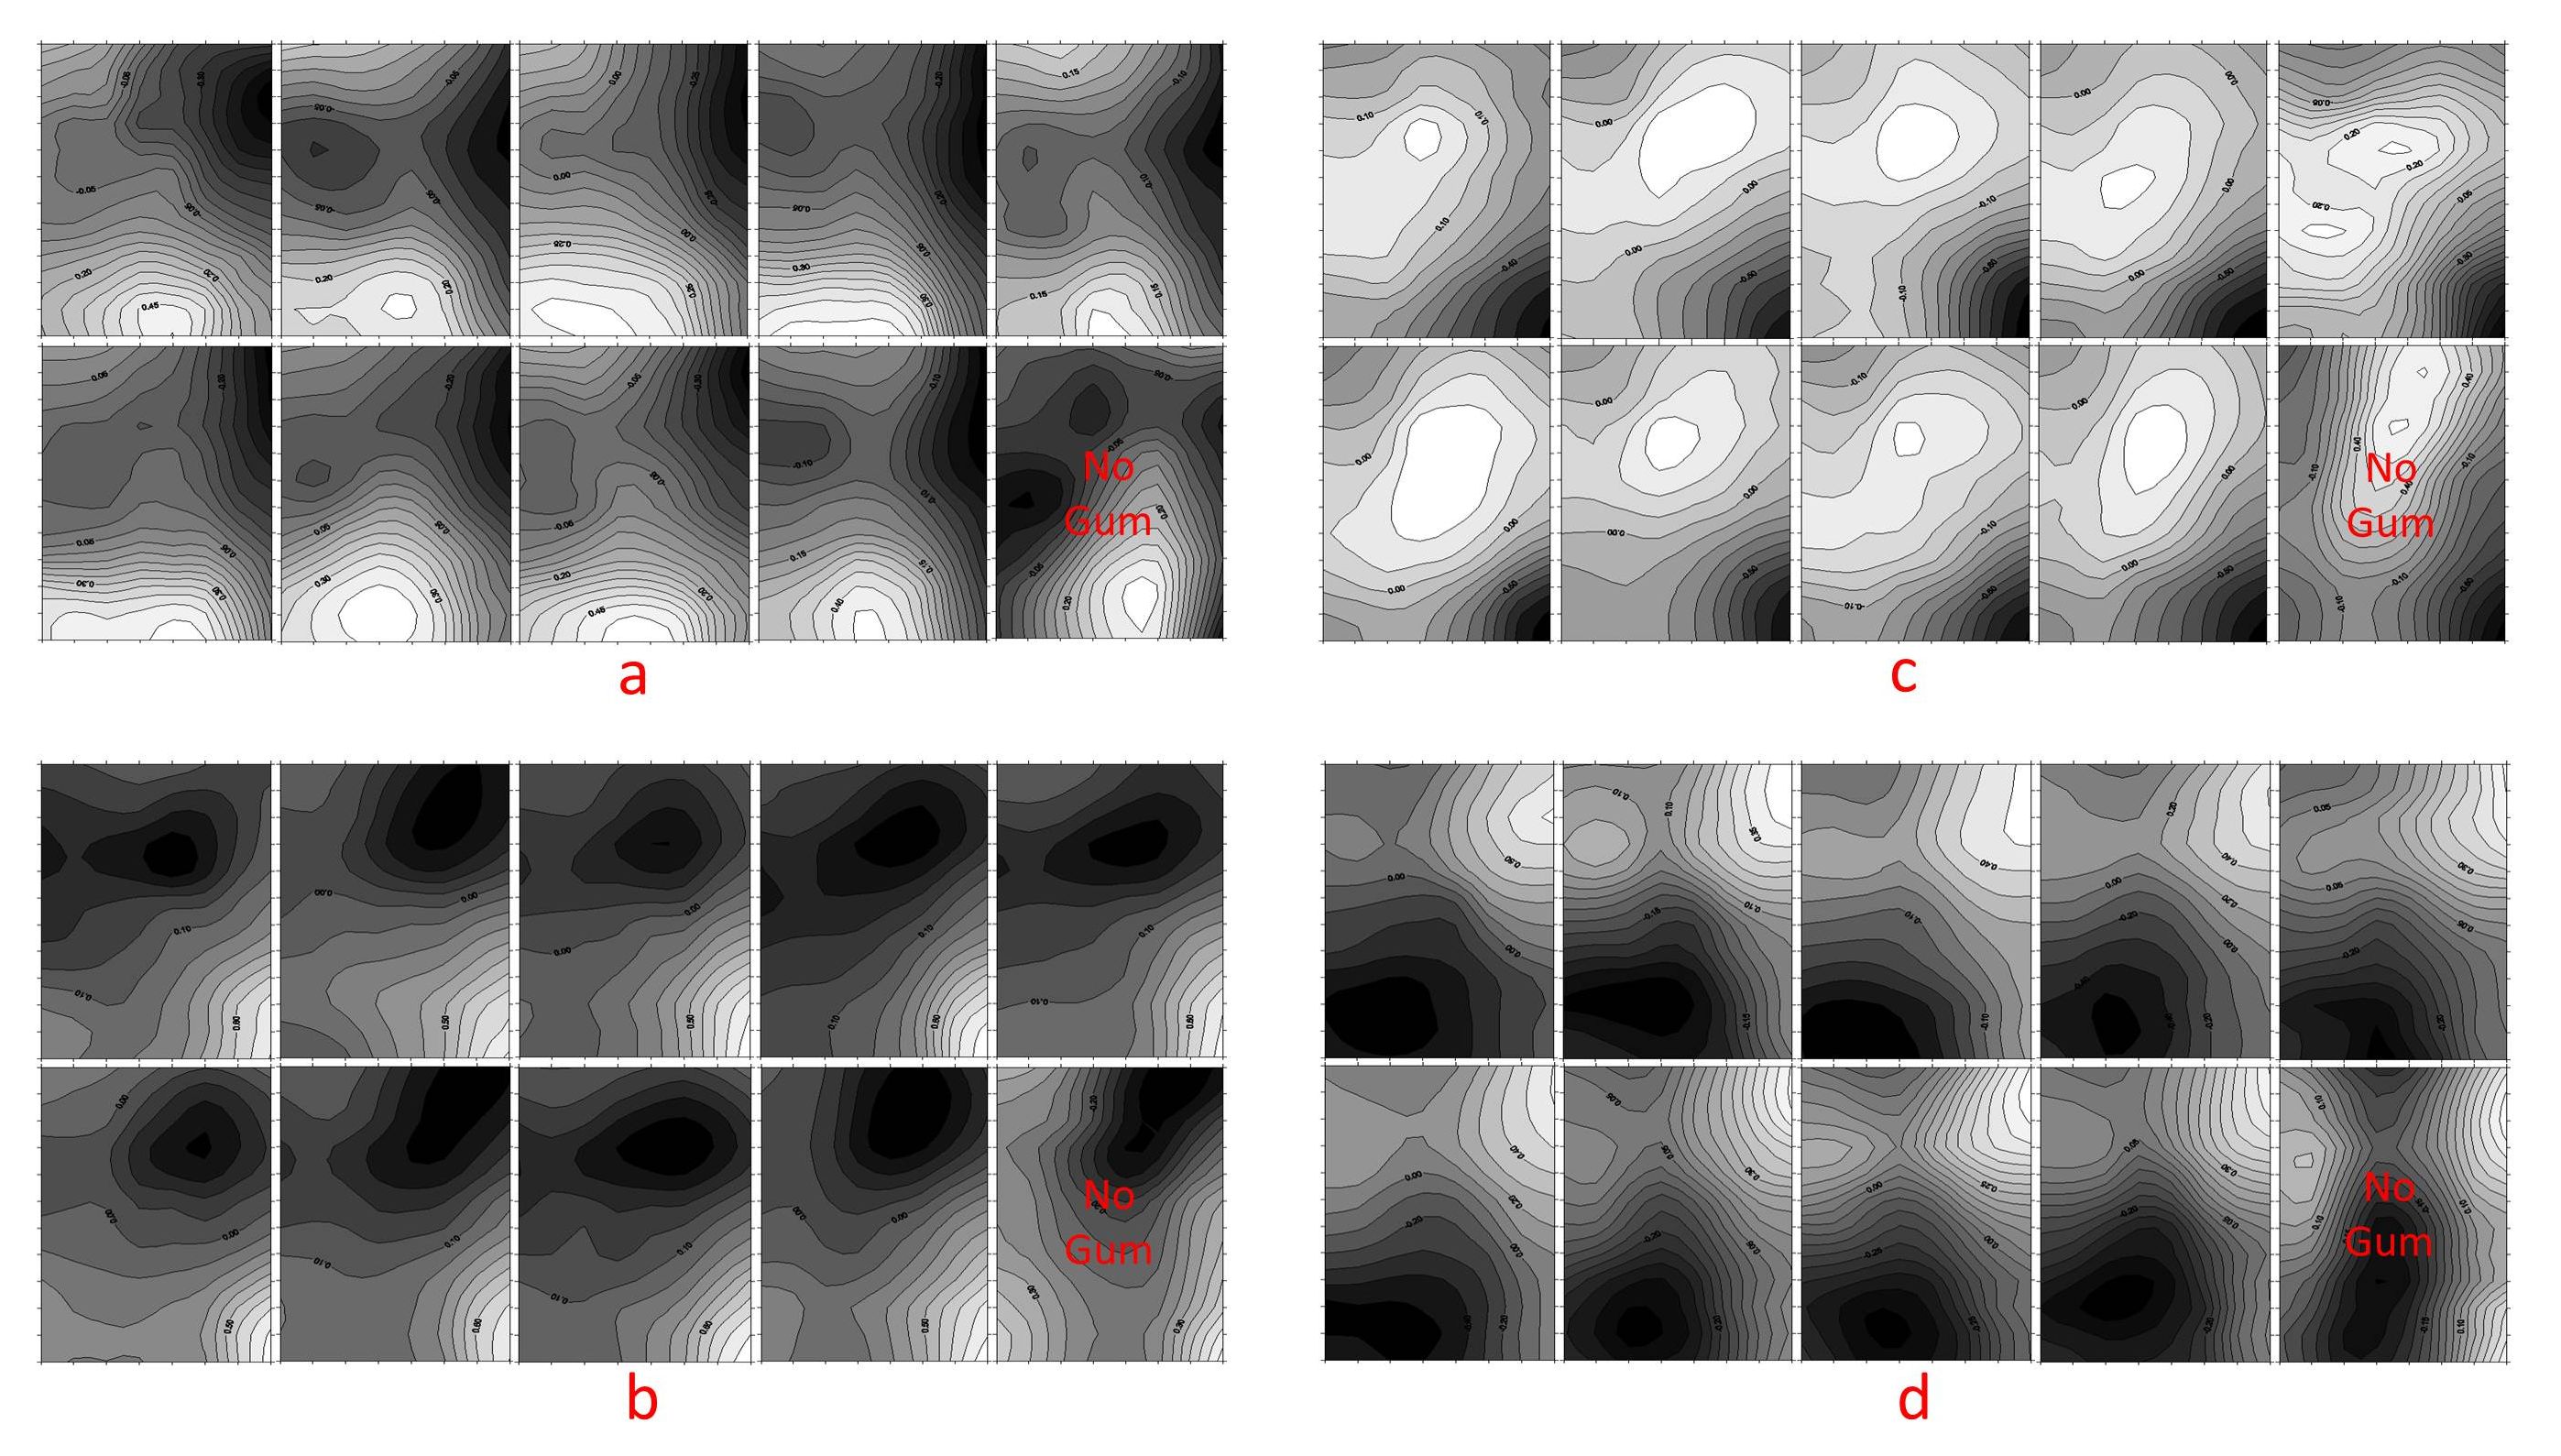
Figure 8. Relative patterns calculated for all four positions comparing the results from 10 same plate-number, same plate-position plate blocks of the LR #25981 ½ cent dry-printed 1953 Franklin stamps. All of the relative patterns for each position are nearly the same. One block was without gum and gave slightly different results. These very reproducible patterns appear to be plate differences in the impressions made by the transfer roll.
These findings result in two decisive observations. First, each stamp within a plate block reveals an individual profile of second-order corrections as illustrated by the four distinct patterns in Figure 8. Secondly, this profile is remarkably similar for stamps originating from the same position on the printing plate. This finding suggests that the printing plate itself is responsible for the intra-sheet differences that are reproducible from sheet to sheet.
These slight “quirks” between the impressions on a plate liked occurred in the manufacture of the plates. Each design impression on a soft steel printing plate was made by “rocking in” the design using a hardened-steel roller, frequently called the “transfer roll,” with very high pressure. This process, called siderography, is manual, and consequently variable. The periodic application of high pressure as the design is “rocked in” by the transfer roll results in a plastic flow of the soft steel in the underlying plate that is displaced near its surface. If the plate is moved too quickly under the roller, or if the pressure of the roller is increased too quickly, this can result in a wave of steel in front of the roller that elongates the impression and distorts the image. This is known as a transfer shift (Granzow, 2012). Under careful operation these large transfer shifts should not occur, but distortions are expected because metal must be displaced according to just how each transfer is manually rocked in. The consistency in Figure 8 across all of these different printings from the same plate positions suggests that we are directly observing the intrinsic relative differences between the plate impressions.
Relative Plate Distortion Patterns
The results in Figure 8 demonstrate that combinations of image subtractions can estimate how each plate position differs from the average impression on the plate. An important question is: how many stamp image differences are needed for a good representation of the average impression? The following examples describe a series of comparisons in which the relative patterns are recalculated with larger numbers of stamps and with alternative choices of these stamps. In some cases these calculations were replicated with the same positions on a second sheet of the same plate number to check repeatability. Figure 9 shows the general scheme for these comparisons in which a block of four outlined in red is selected, and a variety of larger overlapping blocks are independently used to recalculate these relative distortion patterns using additional stamps.
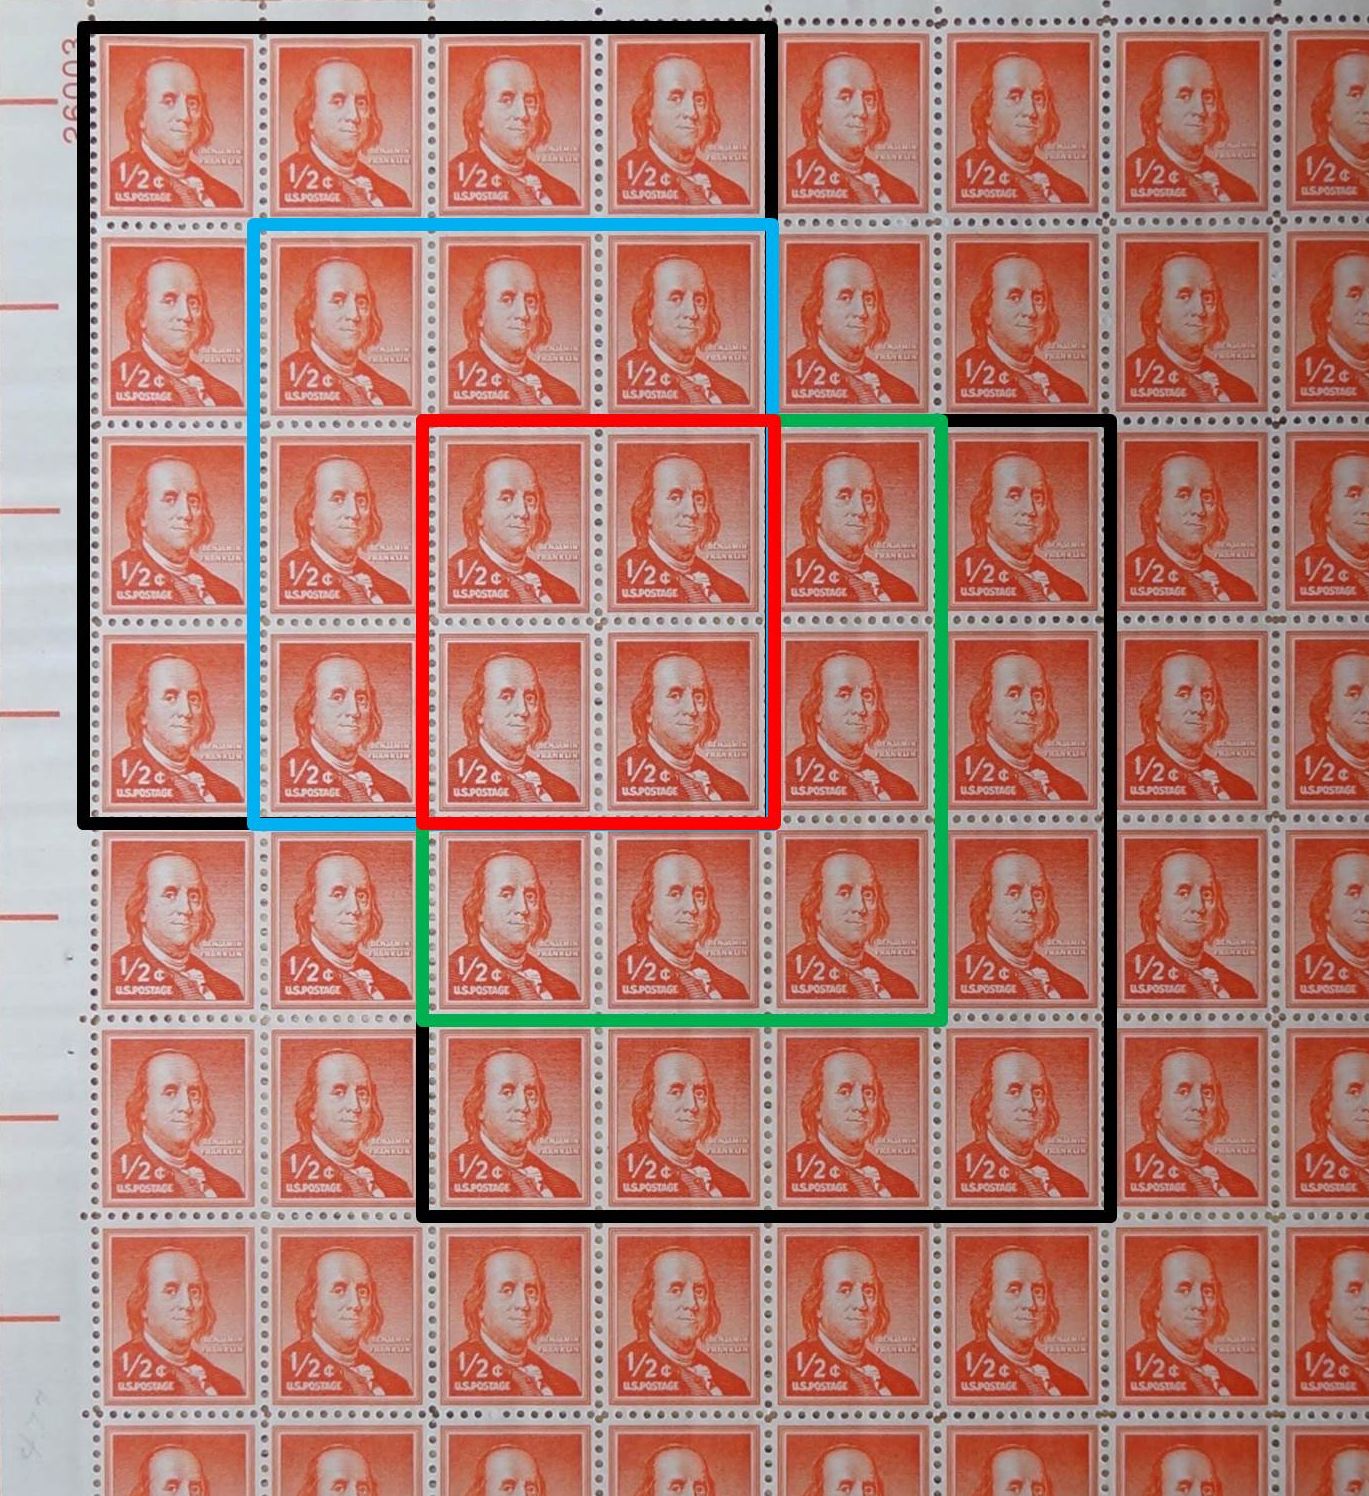
Figure 9. Overlapping blocks for comparing the calculations of the relative distortion patterns using different numbers and choices of stamps.
Figure 10 shows the relative patterns computed for the five different overlapping blocks in the sheet illustrated in Figure 9, the identical computations also being done on a second sheet. Figure 10 shows that the contours for the relative distortion patterns change as additional stamps are included in the computation, especially in going from a block of four stamps to a block of nine stamps. Comparing the patterns for the block of four stamps bordered in red, it is clear that the changes vary according to the different stamps that are used. Examining the upper right stamp as an example, the contour plots are similar between the left pairs of 16- and 9-stamp blocks for each row in Figure 10. The contour patterns are also similar between the 16- and 9-stamp blocks on the right. Comparing the patterns on the left with the patterns on the right, however, shows both have some similarities and differences. Comparing sheet 1 and sheet 2 for the x or y components shows general similarity. In many cases the changes are large in comparing the 9-stamp blocks with the 4-stamp blocks.
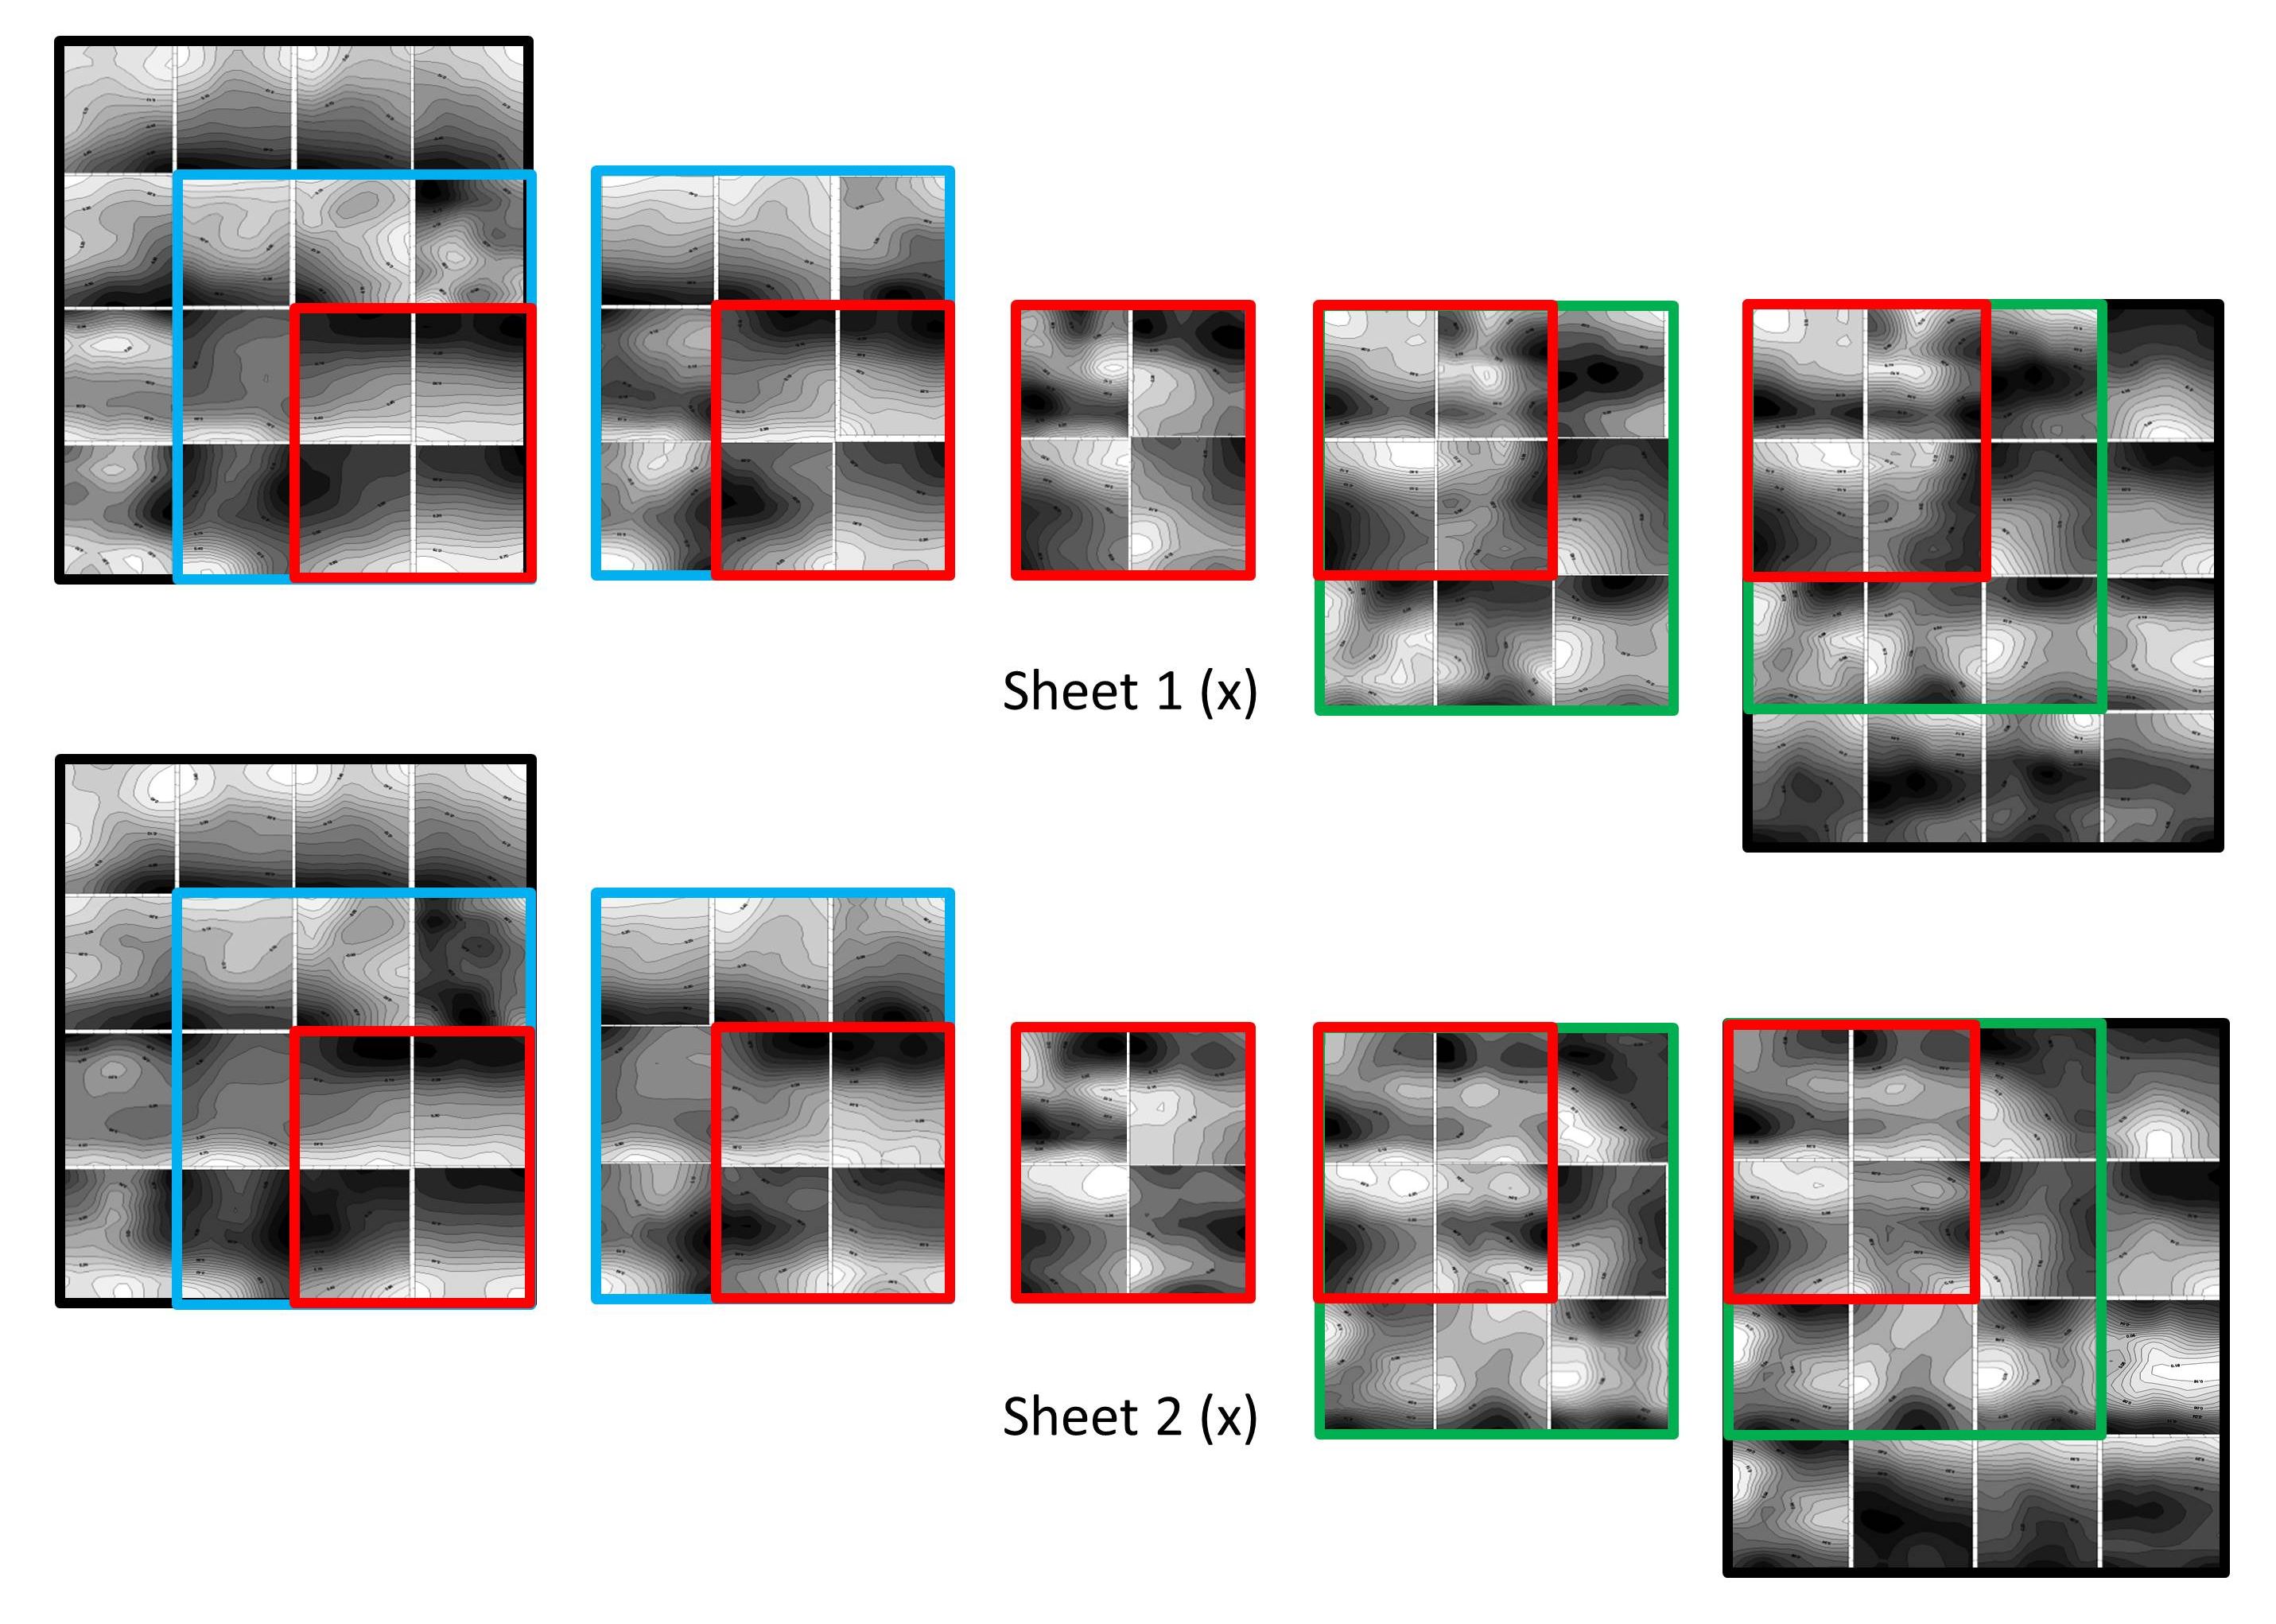
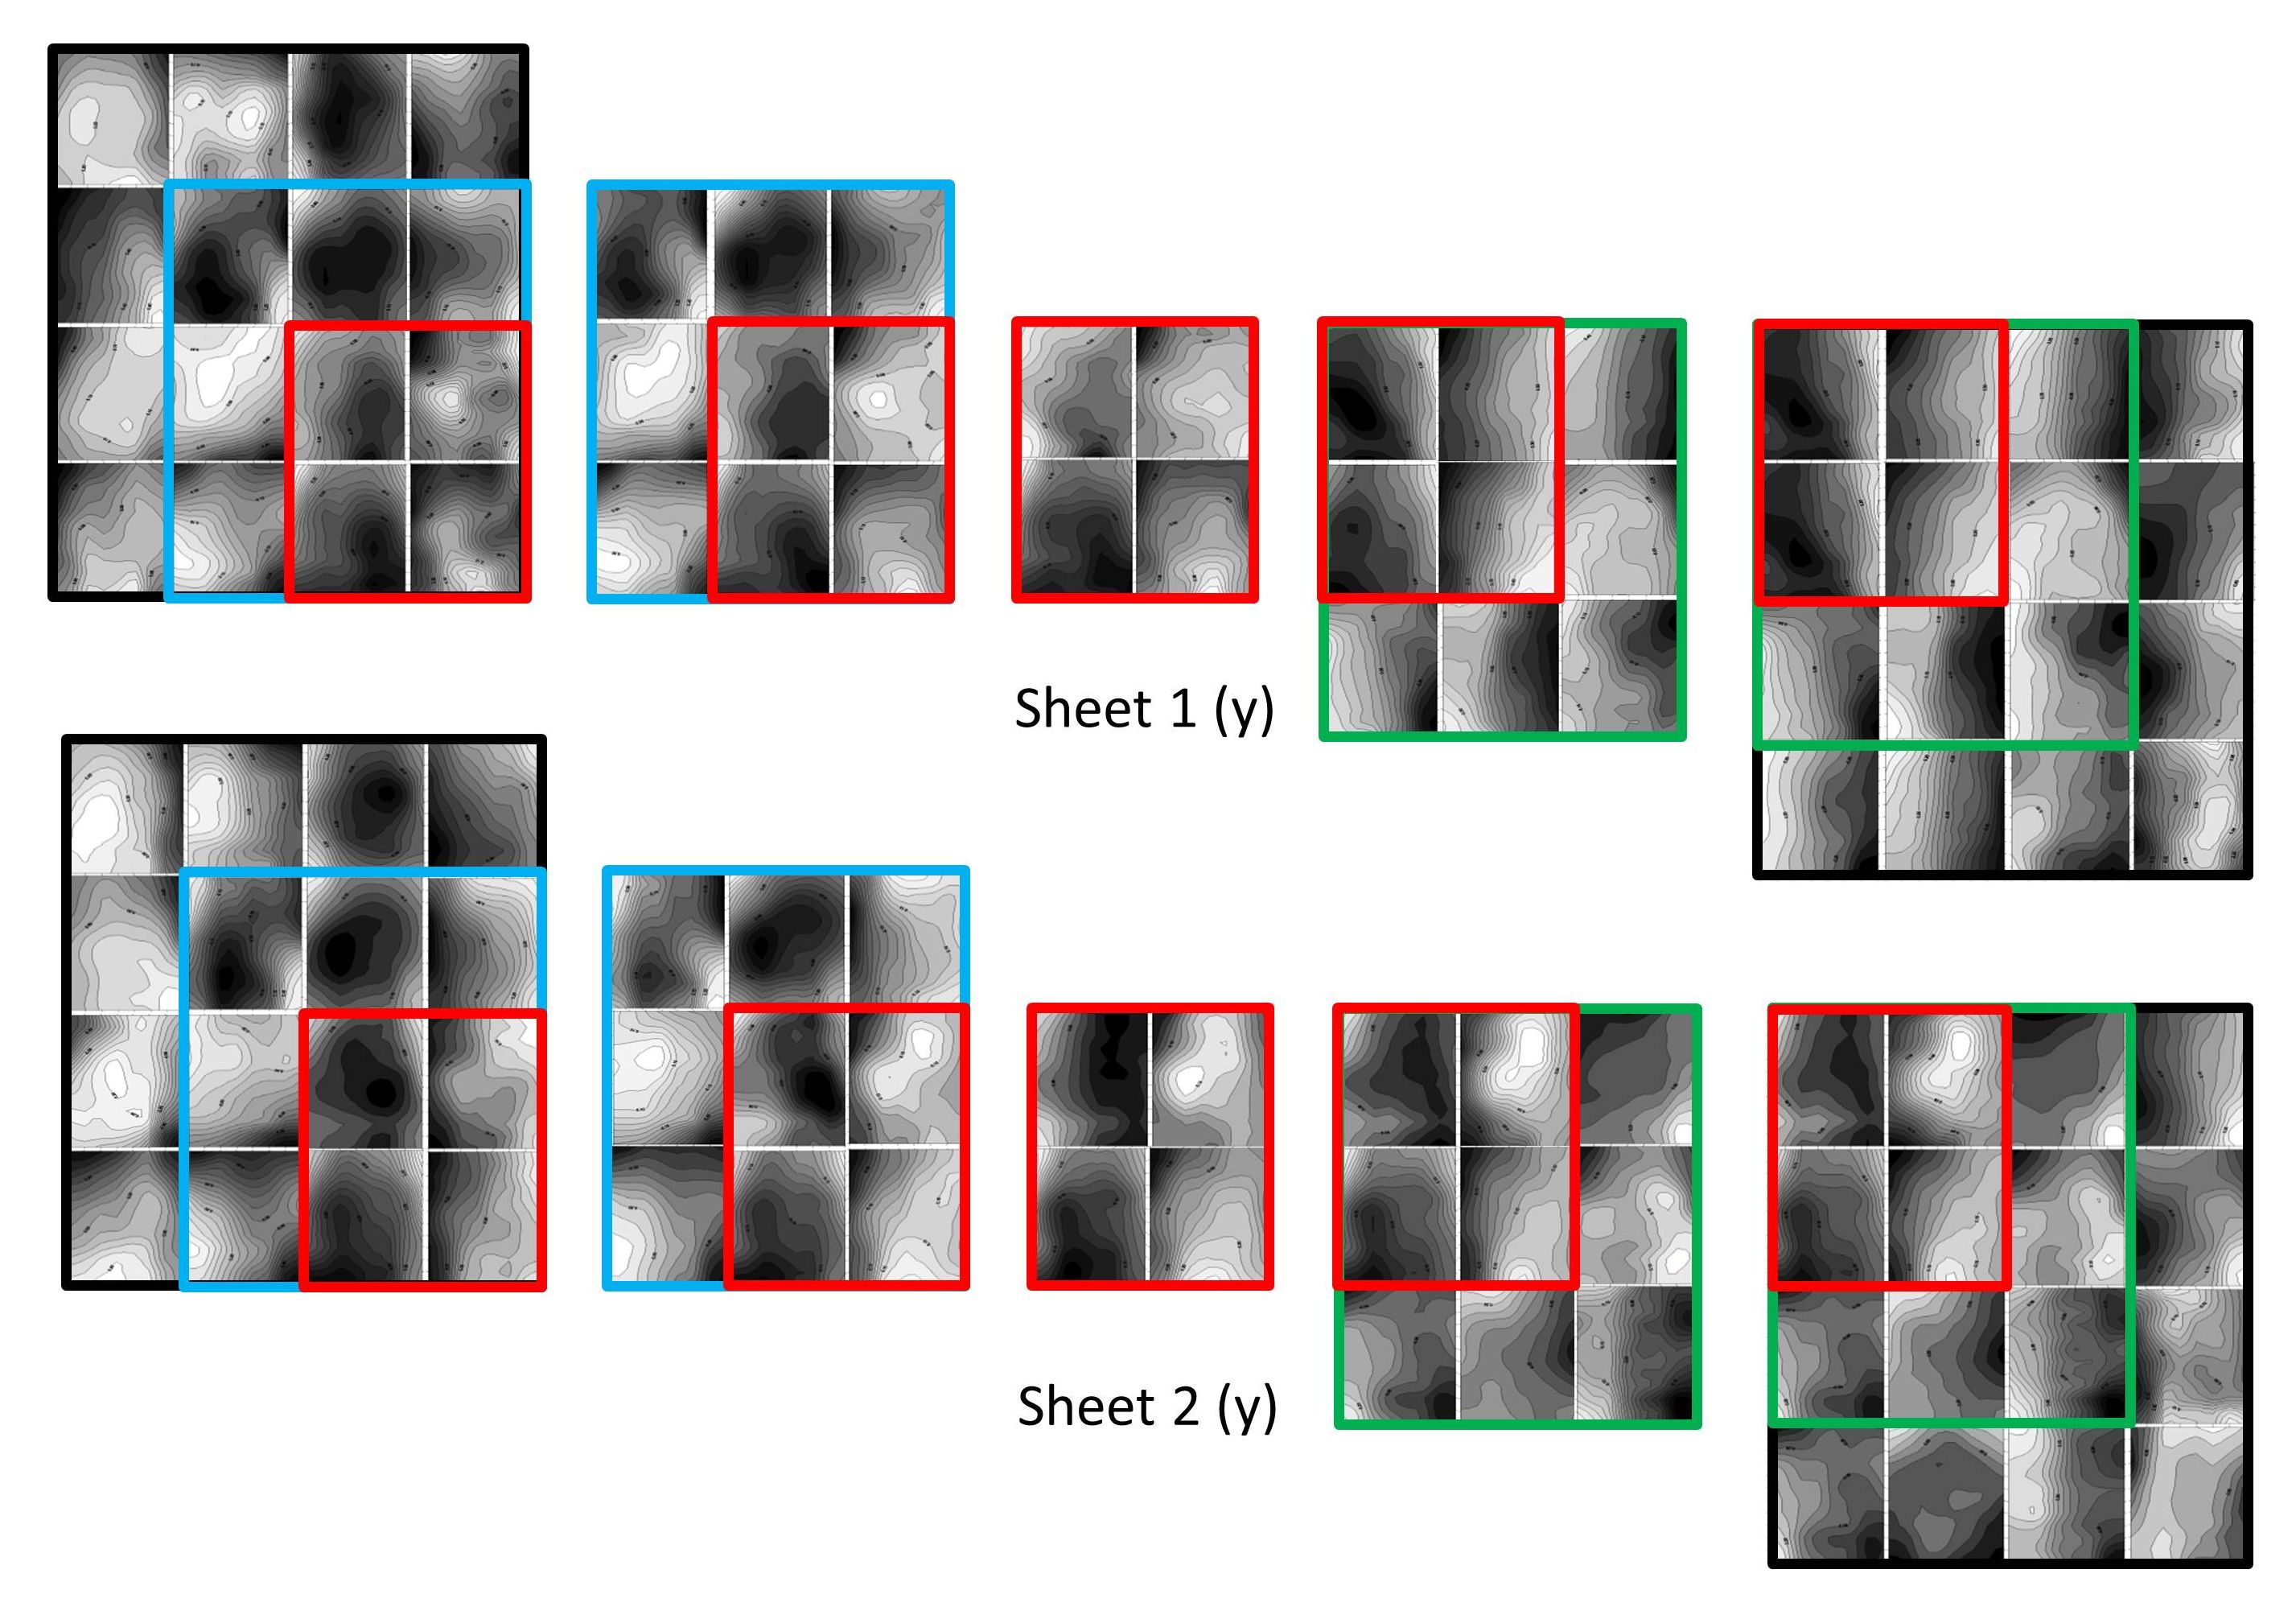
Figure 10. Relative distortion patterns calculated for the different blocks shown in Figure 9 applied to two of the same plate number sheets. The x contours are for the horizontal components of the second-order corrections, and the y contours are for the vertical components. Increasing the number of stamps used in the differencing from 3 to 8 can shift the patterns, but increasing the number of stamps from 8 to 15 shows little further effect. While very similar results are obtained with the second sheet, it is clear that the results vary according to the specific stamps selected for the differencing calculations.
It is not surprising that the relative distortion patterns should shift in going from combinations using only 3 differences (a block of 4 stamps) to 8 differences (a block of 9 stamps) since 3 differences may poorly represent the average impression on the plate. It is clear that a large number of image differences may be required to represent the average plate impression, and that the differences observed between sheets may still represent some residual inhomogeneity.
Other sheets of stamps were analyzed using the same series of overlapping blocks to compare patterns. The wet printed plate #25263 ½ cent Franklin postage stamp of 1953 gave similar and matching results with two sheets of stamps. Similar results were also observed in the study of a single sheet of plate #21149 experimental electric-eye perforated 2 cent Washington stamps of 1935. Again, the choice of additional stamps used in the calculations affects the patterns.
A similar analysis of overlapping blocks in a 6x6 multiple of the 1/8 cent proprietary U.S. revenue of 1898 is shown in Figure 11. The plate number is unknown. Interestingly, the results are more similar to each other than in the previous examples. Again comparing the upper right stamp in the red block of four, this contour pattern remains nearly the same across the sets of 5 blocks. It appears in this example that the various groups of stamps happen to have collectively similar characteristics, resulting in more consistency of the computational results.
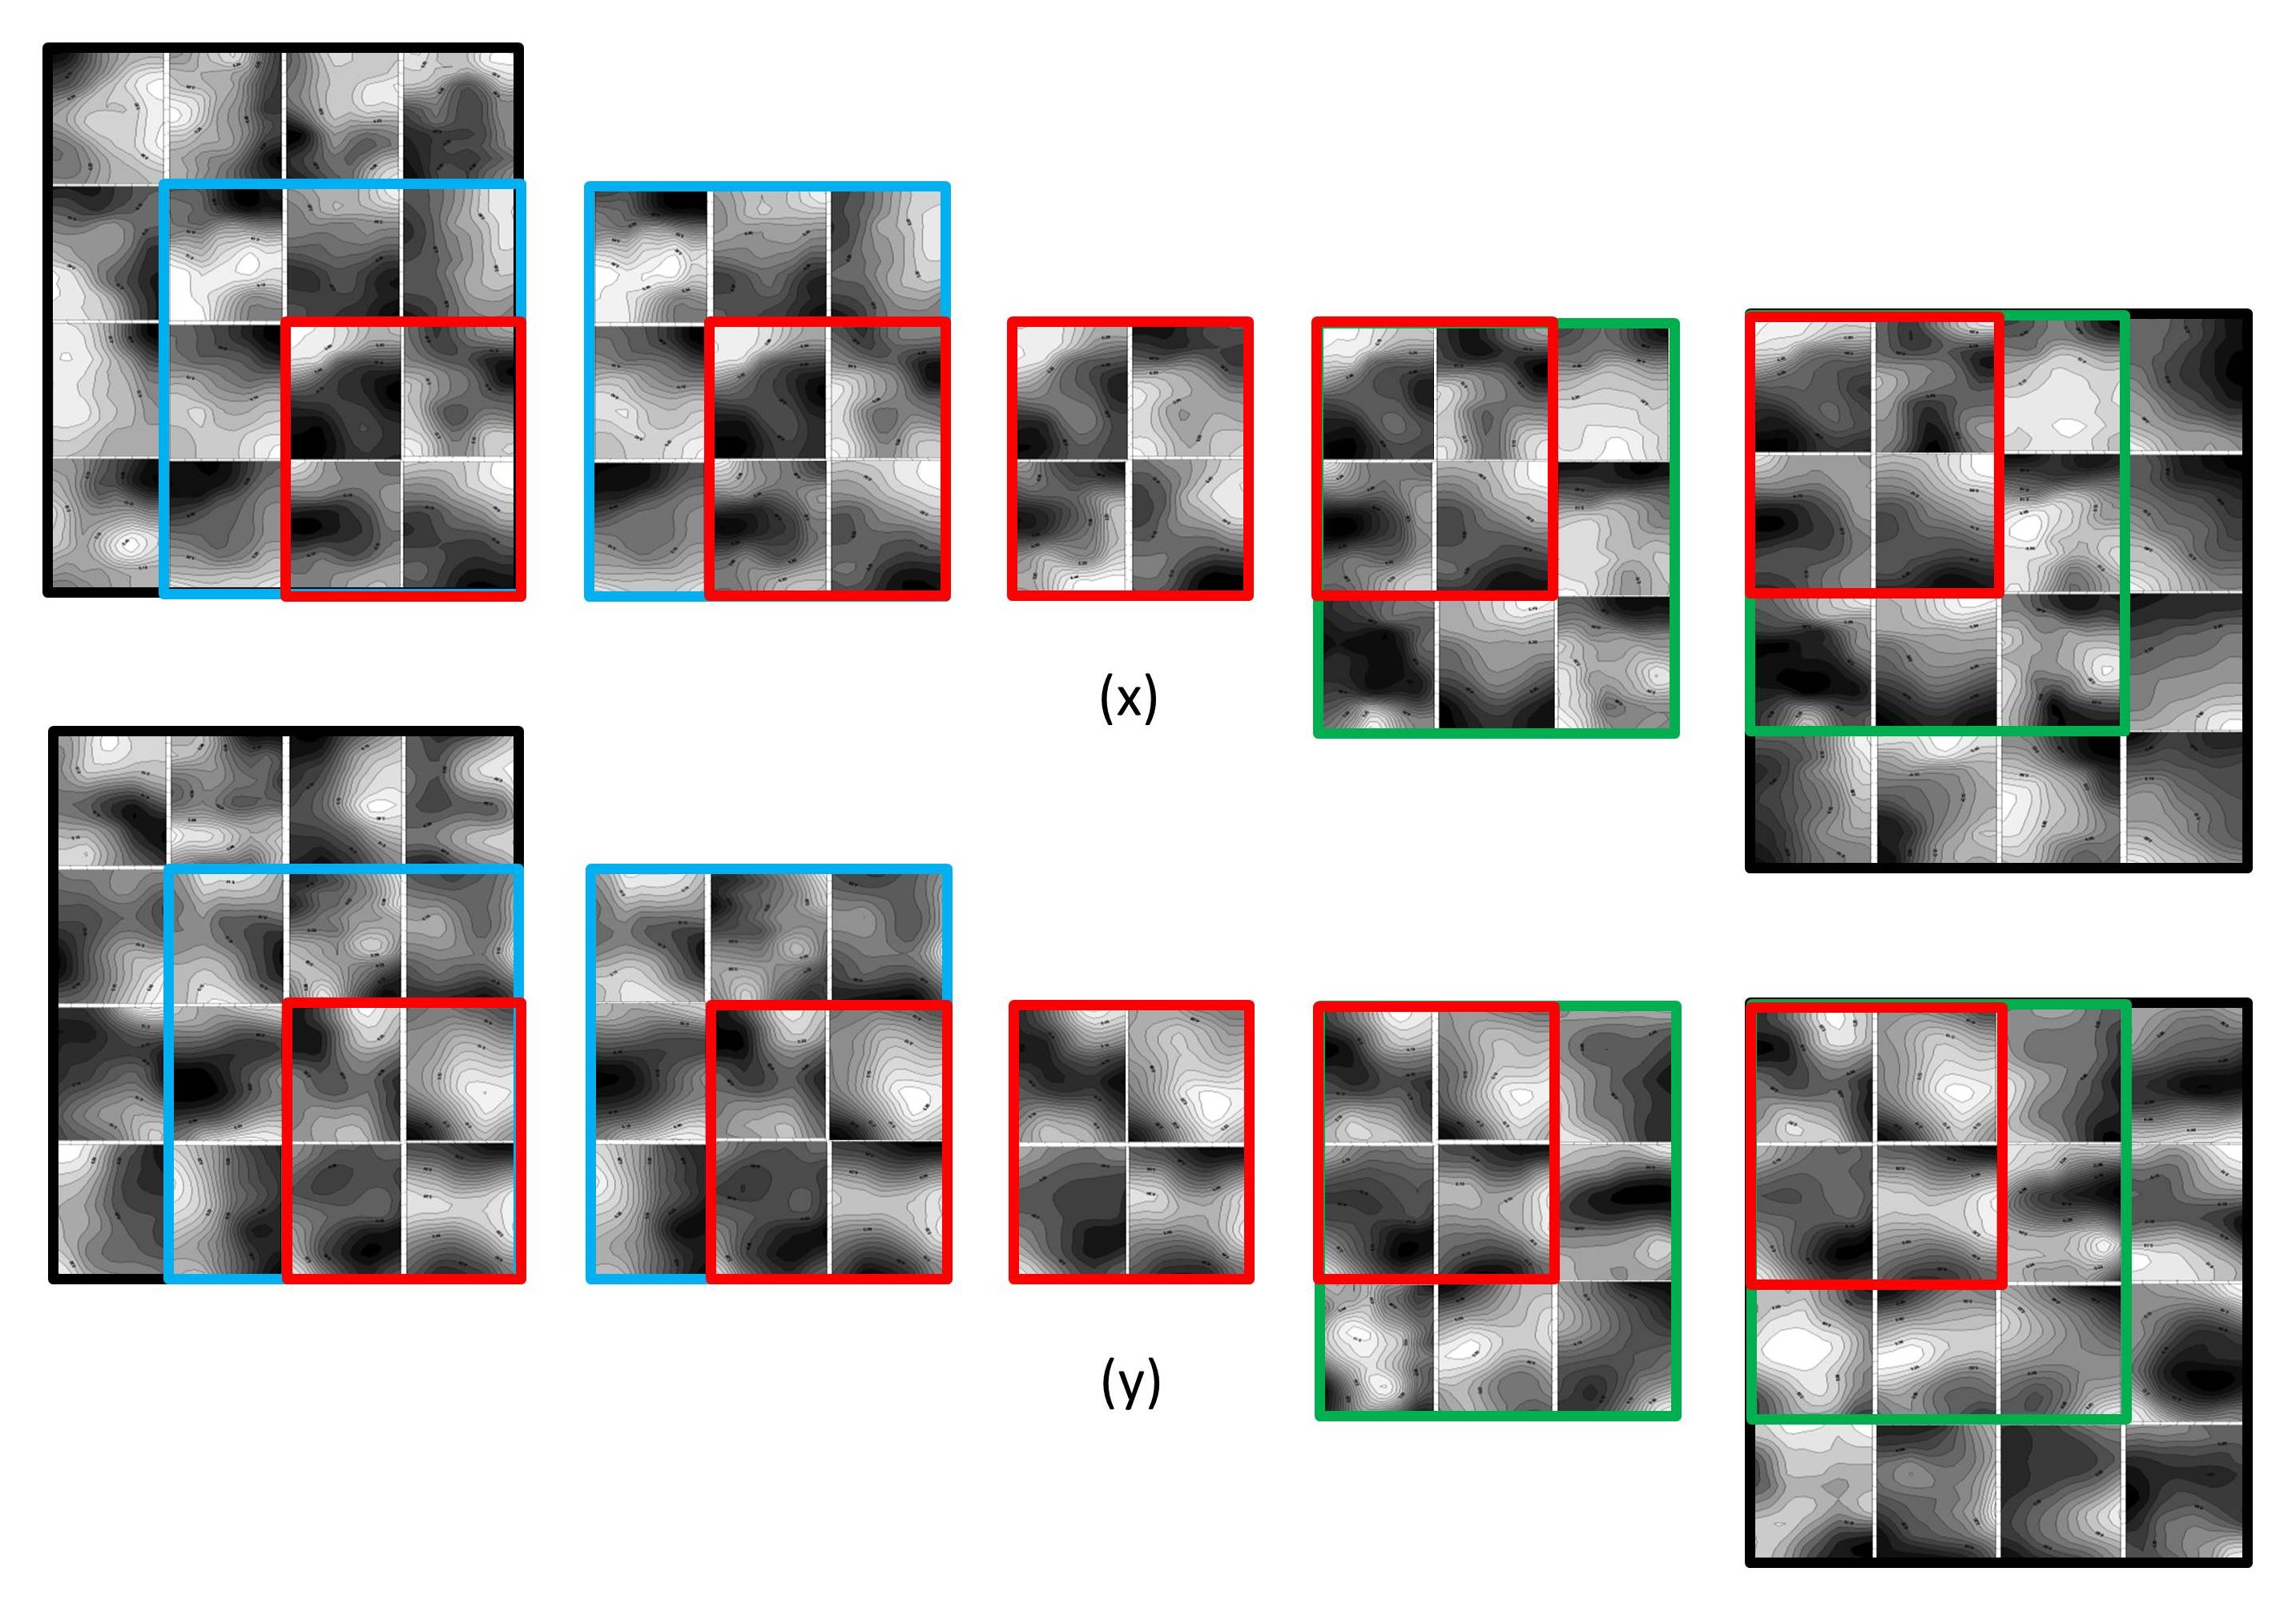
Figure 11. Similar analysis of overlapping blocks in a multiple of the 1/8 cent Proprietary revenue of 1898. The different choices of stamps right and left of center have coincidentally similar results.
Figure 12 shows the same analysis of a 12x10 multiple of the perforated 1 cent Proprietary U.S. revenue stamp of 1862. Each stamp on the sheet was manuscript pre-canceled using fine letters with black pen near the center, but the sheet was unused and has original gum. The results are shown in Figure 12. Similar to the previous example of the 1898 revenue stamps, the results calculated with different groups of stamps give mostly similar comparison results. An unusual feature of this early sheet of stamps is the spotted distortion patterns. This does not appear to be caused by the manuscript cancels because these are near the centers of the stamps. Also, the manuscript cancels are thin script in black, effectively null data which little affect the calculation of the second order corrections; the presence of the cancel does not appear to cause misalignments of sections in the computation of the second-order corrections.
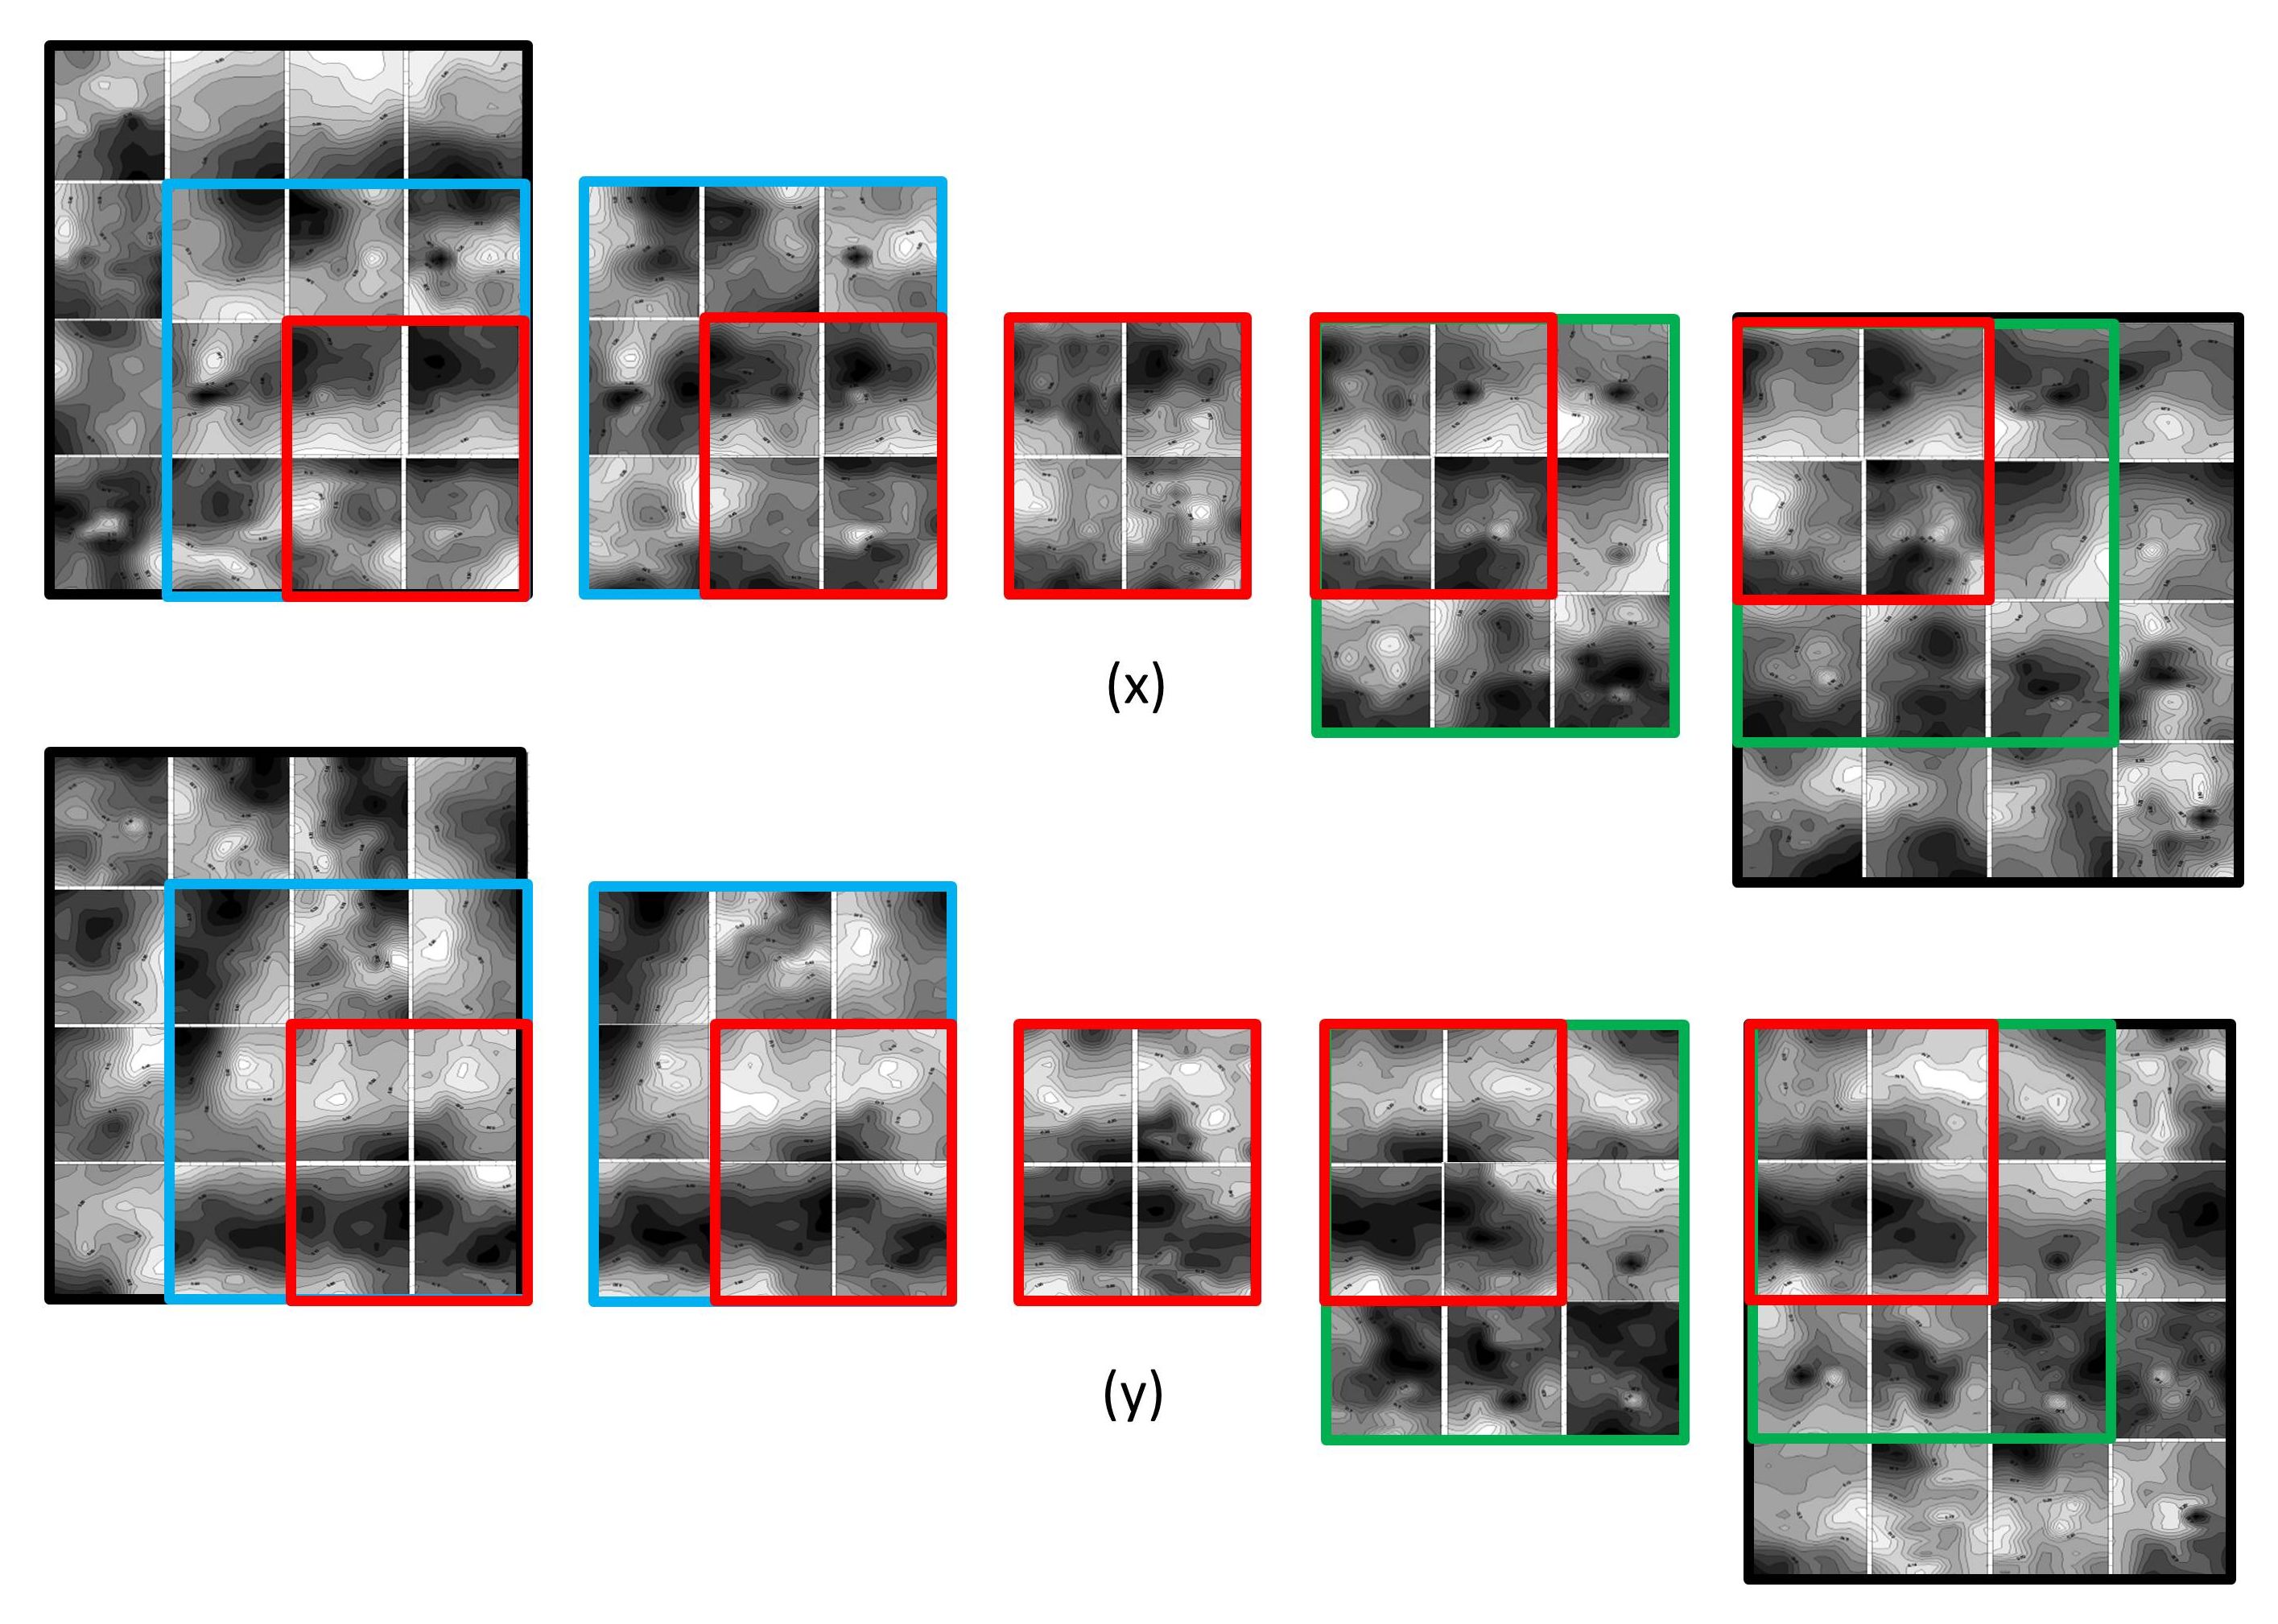
Figure 12. Comparison of overlapping block results for a large multiple of the 1 cent Proprietary revenue stamp of the 1862 First Issue. This example gives similar results to the other comparisons with overlapping blocks, but differs in the more irregular and spotted contours. The cause of this irregularity is not known.
A possible cause for the unusual distortion patterns in Figure 12 could be the situation in which these plates were manufactured. The First Issue revenue plates were made in the early days of siderography, and the contractor, Butler & Carpenter was under great strain to produce revenue stamps very quickly for the U.S. government. While the 1 cent and 2 cent Proprietary stamps were actually the first two stamps printed and distributed by Butler & Carpenter in September 1862 (Toppan, Deats, and Holland, 1899), the production date of the tested block is not known. The fact that it was pre-canceled (initials only, no date) and never used presents the possibility that it was a remainder late in the period of taxation. Given the struggle of the contractor to produce plates during the First Issue, it might be tempting to attribute the more irregular distortion patterns in Figure 12 to hastily produced plates, but this could also reflect a materials problem with certain early plates in the Perkins Bacon process.[11] More testing is needed to determine if this feature is found in other of the First Issue revenues, or whether these more irregular patterns are peculiar to this large multiple. There is gum disturbance on some of the stamps, but the areas of these disturbances do not appear to correlate with the irregularities of the contour patterns.
Conclusions
This research demonstrates the ability to directly compare one high resolution image of a stamp with another, pixel-for-pixel. This is done by determining an array of local, second-order adjustments to correct for distortions between the images. The principal distortion between sheets is paper shrinkage, and this was confirmed to be a large effect by direction measurements of expansion and shrinkage by wetting and drying, at least for intaglio-printed stamps. The corrected subtractions show fine detail of the differences over the full extent of the printed stamps, and can be used to compare plate differences due to re-entries, plate flaws, and forgery. It is possible to reveal faint features that are very poorly visible in the original stamps as demonstrated with the example of the plate cracks.
The second-order corrections themselves reveal relative distortion patterns between different impressions on the plate when computed using stamp images from the same sheet. This intra-sheet comparison compensates for gross paper shrinkage after printing. The distortion pattern for each stamp impression relative to the average impression on the plate can be estimated using combinations of these intra-plate image subtractions. These patterns appear very repeatable if stamps from the same position are used.
Because using a large number of stamp image differences from a sheet can give the most reliable estimate of the average impression on the plate, there is the possibility that an idealized, average plate impression can be reliably determined by using a sufficient number of stamps. This could provide a synthetic representation of the particular transfer roll relief that was used to create the plate impressions. With some scaling factor for sheet shrinkage determined from the size of a stamp, it is possible that this image of the average impression could be directly differenced with any single stamp for characterization purposes. If successful, the resulting correction patterns could have value for determining possible plate positions based on the correlation of these patterns with different plate positions.
Appendix A. Description of the Image Differencing Calculations
The first order alignment of the images is accomplished with a correction, A(x,y), applied to the first image I1(x,y) before differencing it with the second image I2(x,y). The function A(x,y)=T(x,y)+R(θ), where T(x,y) is a translation operation T(x,y)=(x+x0,y+y0), and R(θ) is the rotation by angle θ

and x0, y0, and θ are initially estimated from the differences of the stamp center coordinates and the slopes of the stamp boundary lines.
The new calculated coordinates for the first image’s pixels from the correction A(x,y) are interpolated into the second image’s coordinates using bicubic interpolation (Keys, 1981). For one dimension, the interpolation p(t) between points a0 and a1 using a linear factor t ranging from 0 to 1 is:

For two dimensions first applied once in x and again in y using factors tx and ty, where each ranges between 0 and 1, the bicubic interpolation is expressed as:

The Nelder-Mead simplex optimization minimizes the difference function F for each dimension of color

The correction function A(x,y) expands with the inclusion of the second-order corrections to A(x,y) = T(x,y) + R(θ) + S(x,y), where S(x,y) is the interpolation over the grid of the local sectional corrections. Each local section is re-optimized by the simplex method beginning with the data already transformed with the first order T + R corrections. The local re-optimization is done in 2 parameters with adjustments to x and y only. Using the center coordinates of each section, S(x,y) is determined using bilinear interpolation between the center coordinates:

Where Px and Px are the second-order x and y corrections found for each section in the i x j array of sections, and δx and δy are the fractional distances (0-1) between section centers. For x or y values having coordinates outside the ranges of the section centers, the local section’s correction is used.
The color correction, C(x,y), introduces an additional term to the function F for minimization:

where C(x,y) is a correction determined by a quadratic Bézier curve of the form mapping the range of byte values 0-255 from one axis to the other. P0 and P2 are constrained to points (0,0) and (255,255), while simplex optimization is used to determine the coordinates of the intermediate Bézier curve point P1(x,y) so that the curve parametrically maps x values to y values which represent a color correction to the x values. The Bézier curve can be written

The trapezoidal mapping that can be used as an alternative to the three-parameter optimization of translation and rotation is simply a bilinear mapping between two trapezoids. This computation is fast since it does not rely on optimization, but the centering of the mapping is more dependent on the quality of the virtual corner calculations than on the overall alignment of the image data. The second-order corrections are sufficiently robust to provide equivalent overall subtraction results, but are not typically as well centered as the results with the three-parameter optimization for applications where combinations of the second order corrections are of interest for comparing distortion patterns.
The differencing of images can be used to estimate the distortion pattern of an individual stamp relative to the average pattern of a group of other stamps. For example, there are six possible differences, A throughF, that can be taken with a block of four stamps labeled a to d. These are A = a-b, B = a-c, C = a-d, D = b-c, E = b-d, and F = c-d. A through F can each be viewed as a pair of matrices of second-order corrections, one for the x corrections and one for the y corrections. In effect, this calculation is just linear combinations of matrices of these second order corrections. The average of the first three differences listed above is (A + B + C)/3 = a + (-b - c -d)/3. If the relative patterns for b, c, and d are sufficiently dissimilar, then the second term (-b - c -d)/3 can be small enough to ignore as an approximation. Then, a ≈ (A + B + C)/3. Other linear combinations of the image differences similarly provide estimates for the other stamps’ relative patterns. For n stamps, there are n(n-1)/2 different possible combinations, and these can be represented by an n by n-1 matrix in which the different combinations are first entered to the upper right triangle of the matrix. These entries are then mirrored about the diagonal to a lower left triangle with a change of sign to fill the matrix. The mirrored entries are bolded in the example below to emphasize this symmetry. The different linear combinations for the estimated relative patterns are averages of the horizontal rows in the matrix. This approach was used to compute the more complicated linear combinations for the general case of n different stamps. The linear combinations for the approximate relative patterns for the example block of 4 stamps is then:
The sets of equations are not linearly independent and are therefore reduced to approximations.
References
Ceresa, R.J. 1993. The Postage Stamps of Russia 1917-23 Volume 4. Transcaucasia Parts 13-16, Section A & B, British Occupation of Batum. Russian Philatelic Desktop Publications, Felpham, England.
Faries, B. 1982. Stamp Printing: Wet, “Dry,” and No Water at All. S. P. A. Journal, 44 (10): 707-708.
A. R. Forrest, 1972. Interactive Interpolation and Approximation by Bezier Polynomials. The Computer J 15 (1): 71-79. Reprinted in Computer-Aided Design 22 (9): 527-537 (1990).
Granzow, G. W. 2012. Line Engraved Security Printing: the Methods of Perkins Bacon 1790-1935 Banknotes and Postage Stamps. The Royal Philatelic Society London, London, England, p. 204.
R. Keys, (1981). "Cubic convolution interpolation for digital image processing." IEEE Transactions on Acoustics, Speech, and Signal Processing 29 (6): 1153–1160.
Lyerla, T. 2014. Scanning for Stamp Shades. J Amer. Philatelic Soc. 128 (7): 666-671.
Mustacich, R. 2014. Freak or Fake? A New Fingerprinting Method for Distinguishing between Original and Fraudulent Extra Perforation of 19th Century Revenue Stamps. The American Revenuer 67 (1): 2-19.
Poliakow, E.V., Poliakov, V.V., Fedotova, L.A., and Tsvetkov, M.K. 2007. High-Precision Measuring Scale Rulers for Flatbed Scanners. Astronomy and Space Science, M.K. Tsvetkov, L.G. Filipov, M.S. Dimitrijevic, and L.C. Popovic, eds., Heron Press Ltd., Sofia, Bulgaria. pp. 356-368.
Nelder, J., and Mead, R. 1965. A Simplex Method for Function Minimization. Computer Journal 7: 308-313.
Toppan, G. L., Deats, H. E., and Holland, A. 1899. An Historical Reference List of the Revenue Stamps of the United States. The Boston Philatelic Society, Boston, MA. Reprinted by Castenholz and Sons, Pacific Pallisades, CA, 1990.
Williams, L. N., and Williams, M. 1971. Fundamentals of Philately. American Philatelic Society, State College, PA, p. 44.
Zeiss 1904. http://www.zeiss.com/corporate/en_de/events/international-year-of-light/optical-technologies.html; see also https://airandspace.si.edu/stories/editorial/finding-pluto-blink-comparator
[1] Example software includes Photoshop (Adobe Systems Inc., San Jose, CA) and retroReveal (University of Utah J. Willard Marriott Library, Salt Lake City, UT).
[3] All images in this article were collected at 1200 dpi using a Canon 9000F scanner with the unsharp mask and high contrast settings active. These settings provided significantly sharper image differencing results.
[4] Please note that this process also applies to most stamps with irregular borders, as shown in the example in Figure 1.
[5] See illustration accompanying Scott No. R5
[6] It is less strain on the eyes to view the byte complement of the subtraction. While nearly equal pixel values would result in near zero differences, i.e. shades of black, for single byte color values it is preferable to view 255-S where S is the absolute value of the difference of the pixel values. This provides a white background when equal pixels are subtracted from each other, with increasing differences in the pixel values resulting in darker colors.
[7] With the color images, the optimization minimizes the sum of the absolute values of the differences for each of the color channels. Also, prior to the final subtraction, each of the three image colors is independently optimized with a quadratic Bézier mapping, just as in the one-dimensional color case of the 8-bit gray scale image subtraction.
[8] Scanning results can vary significantly over the area of the platen. Repeated use of the same location within a few mm minimized this variation. A protocol using a mask, described in a later section of this article, minimized this variation. All scans described in this article follow this scanning protocol.
[9] All stamps used in this study of the reproducibility of second-order corrections were mint, never-hinged stamps unless otherwise described.
[10] All sheets and plate blocks were stored in identical air and relatively constant ambient humidity. The changes in ambient humidity are not believed to be large enough to result in significant differences in the scans.
[11] The manufacture of printing plates for early postage stamps was during a time of evolving materials technology, especially for the reliable case-hardening of steel after the design transfers were made to soft steel. Changes were being made to the steel materials for improved hardening to reduce wear, and to reduce plate cracking under stress (Granzow, 2012).